Global Cooling

No, but I have gotten fed up with all that talk from the GW alarmists. News item after news item, 'little Ellie May says the birds are here earlier every year', ' Max has to put away his snowmobile earlier this spring...', "Grandma Wilson doesn't ever remember it being this warm on Christmas Day (never mind that Grandma Wilson doesn't rememeber what she had for breakfast!)', and on , and on, and on.

That frustration does make it easy to try to toss it back and see what the response is. It's probably meaningless, long term trends are what is important.

I did hear another science podcast out of Australia today. The guy was talking about how we had a cooling period from (IIRC) about 1750 - 1890. So, all this glacier melting stuff may just be the result of the ice building up over that cooling period, and we are returning to something closer to 'normal'.

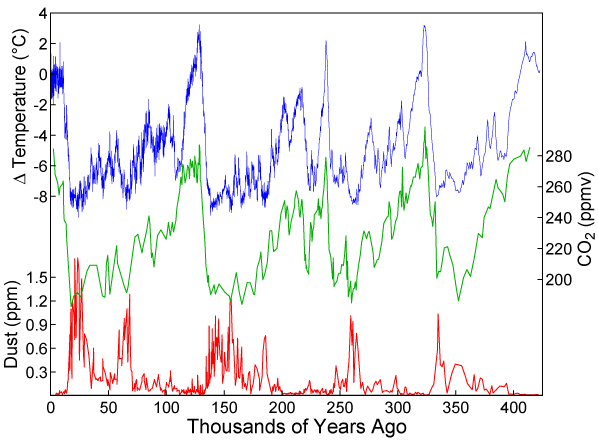
Now, T-AL has a good graph of warming over the past 1000 years, but let's look back further:


Climate - Wikipedia, the free encyclopedia

Maybe we are right on schedule?

-ERD50

So are you in the
isn't happening
isn't our fault
is a good thing
can't do anything to stop it
camp?
 
No, but I have gotten fed up with all that talk from the GW alarmists. News item after news item, 'little Ellie May says the birds are here earlier every year', ' Max has to put away his snowmobile earlier this spring...', "Grandma Wilson doesn't ever remember it being this warm on Christmas Day (never mind that Grandma Wilson doesn't rememeber what she had for breakfast!)', and on , and on, and on.

That frustration does make it easy to try to toss it back and see what the response is. It's probably meaningless, long term trends are what is important.

Exactly. The anecdotal stuff is meaningless whether it support the "getting hotter" or "getting colder" camp. We're talking about a fraction of a degree worldwide here. That's NOT to say that a fraction of a degree isn't important--it could be, in the big scheme of things, over many years. But observations/anecdotes of when the flowers bloom, how much snow we had this year, or how thick the caterpillar coats have gotten are entirely irrelevant.
 
They're scientists, not "scientists."

What's so hard to understand about short-term fluctuations as part of a long-term trend?

I don't think that's possible ;) It never ever happens in other complex systems such as the stock market for example ;)
 
What's so hard to understand about short-term fluctuations as part of a long-term trend?

The last Ice Age was about 10,000 years ago.

T-Al's chart shows warming in the last 50-100 years.

So, what is 'long term' and what is 'short term'? Isn't one view of this a 50-100 year short-term fluctuation within a long term trend? And, since it has been warmer in the past, maybe this is just part of that long term trend? Or maybe not? How can one know?

-ERD50
 
I'd certainly expect some decade-long up and down cycles. That says nothing about the long term trend.

Nice graph , is there a similar graph that shows solar output during
the same time frame?
 
Doubling CO2 from 250 ppm to 500ppm MEANS from .00025% to .00050%. It's a trace gas! (I may have the wrong amount of zeros in the numbers - itty bitty amounts are hard on the old brain)

Water vapor is somewhere around 90% of the greenhouse effect, depending on whether it is humidity (gee, it feels hot), or clouds (feels colder, doesn't it)

Water vapor accounts for no more than ~70% of the greenhouse effect. Increased CO2 causes increased water vapor, which causes a positive loop for global warming.
 
The last Ice Age was about 10,000 years ago.

T-Al's chart shows warming in the last 50-100 years.

So, what is 'long term' and what is 'short term'? Isn't one view of this a 50-100 year short-term fluctuation within a long term trend? And, since it has been warmer in the past, maybe this is just part of that long term trend? Or maybe not? How can one know?

-ERD50

I think my husband explained how one can know in a thread a few months ago. The causes of warming in the past are fairly well known, and those causes aren't in play to explain the current warming.

He's out of town this week and arriving home late on Friday, but I'll try and remember to point him at this thread over the weekend. If there are any graphs out there of long-term solar variability, he'll know about them, on account of that's part of his field of research.
 
I think my husband explained how one can know in a thread a few months ago. The causes of warming in the past are fairly well known, and those causes aren't in play to explain the current warming.

Hold on there. I didn't bring up causes, I simply asked how do you look at that graph and tell if it is a short term fluctuation or a trend.

Forget whether the graph represents temperature or population or auto casualties or anything. People were trying to make inferences from the graph itself. I expressed doubt in anyone's ability to do that from the graph.

-ERD50

Look at the graph in post 18. There are fluctuations from year to year, but over time the trend is clear even though the year-to-year data aren't always in the same direction. The trend in that graph is a slow decline followed by a rapid increase.
 
Well, in that graph you can see some pretty strong trends but there are still variations in the year-on-year data. However, that isn't the graph that's being referred to in this paper. I looked at the Nature article, and the graph shows three projections for surface temperature change in northern Europe over the 54-year period starting in 1996. In each case, the ending temperature was higher than the starting temperature but there were fluctuations on an approximately decadal basis within that general upward trend. The ending temperatures for all three projections were higher than the peaks of the decadal variations; the starting temperatures for two of the three projections were lower than the troughs of the decadal variations.

If you can get hold of a copy of the review article describing the research, it's the 1 May 2008 issue of Nature, volume 453, page 43-35; the research article itself is on page 84-88 of the same issue and has a bunch more graphs.
 
However, that isn't the graph that's being referred to in this paper. I looked at the Nature article...

You lost me - what paper is being referred to? By Whom? What Nature article?

-ERD50
 
According to NOAA, this spring hasn't been especially cold. Large amounts of snow reflect high precipitation, not necessarily abnormally low temperatures. http://www.ncdc.noaa.gov/oa/climate/research/2008/mar/mar08.html

Hmmm, when a certain former vice president can show pictures of less snow on a mountain - it is presented as unquestionable evidence of global warming.

But when a skeptic tries to associate more snow with global cooling - it is just dismissed.

How 'convenient'. -ERD50
 
You lost me - what paper is being referred to? By Whom? What Nature article?

-ERD50

The Nature article being referred to in the link in post 17. That's the article that talks about variations within a longer trend.

Here are the journal details and the abstract.

Letter

Nature 453, 84-88 (1 May 2008) | doi:10.1038/nature06921; Received 25 June 2007; Accepted 14 March 2008

Advancing decadal-scale climate prediction in the North Atlantic sector

N. S. Keenlyside1, M. Latif1, J. Jungclaus2, L. Kornblueh2 & E. Roeckner2
  1. <LI id=a1 minmax_bound="true">Leibniz Institute of Marine Sciences, Düsternbrooker Weg 20, D-24105 Kiel, Germany
  2. Max Planck Institute for Meteorology, Bundesstra
    glyph.gif
    e 53, 20146 Hamburg, Germany
Correspondence to: N. S. Keenlyside1 Correspondence and requests for materials should be addressed to N.S.K. (Email: nkeenlyside@ifm-geomar).


Top of page Abstract

The climate of the North Atlantic region exhibits fluctuations on decadal timescales that have large societal consequences. Prominent examples include hurricane activity in the Atlantic1, and surface-temperature and rainfall variations over North America2, Europe3 and northern Africa4. Although these multidecadal variations are potentially predictable if the current state of the ocean is known5, 6, 7, the lack of subsurface ocean observations8 that constrain this state has been a limiting factor for realizing the full skill potential of such predictions9. Here we apply a simple approach—that uses only sea surface temperature (SST) observations—to partly overcome this difficulty and perform retrospective decadal predictions with a climate model. Skill is improved significantly relative to predictions made with incomplete knowledge of the ocean state10, particularly in the North Atlantic and tropical Pacific oceans. Thus these results point towards the possibility of routine decadal climate predictions. Using this method, and by considering both internal natural climate variations and projected future anthropogenic forcing, we make the following forecast: over the next decade, the current Atlantic meridional overturning circulation will weaken to its long-term mean; moreover, North Atlantic SST and European and North American surface temperatures will cool slightly, whereas tropical Pacific SST will remain almost unchanged. Our results suggest that global surface temperature may not increase over the next decade, as natural climate variations in the North Atlantic and tropical Pacific temporarily offset the projected anthropogenic warming.
 
Hmmm, when a certain former vice president can show pictures of less snow on a mountain - it is presented as unquestionable evidence of global warming.

But when a skeptic tries to associate more snow with global cooling - it is just dismissed.

How 'convenient'. -ERD50

Depends on the conditions. Less snow could be being caused by higher temperatures (if they were such that they were causing melting that wasn't happening before) or by less precipitation. Depending on the situation for the mountain in question, he could have been perfectly correct.

More snow is caused by more precipitation or by lower temperatures. Unless you're dealing with unusually low temperatures, especially in areas that are borderline for snow in the first place, you can't just assume that heavy or prolonged snowfall is a function of overall cooling. We had a lot more snow in early 2007 than early 2008, but I think the latter had overall slightly lower temperatures.
 
We banter about this... but it is a serious subject. Man made, natural causes, natural causes exacerbated by man's pollution and gases. Any combination could be disastrous.

Being green is not a bad thing (in terms of alternative energy sources).
 
Being green is not a bad thing (in terms of alternative energy sources).

But, that's not necessarily true. If choosing these alternative energy sources were cheaper than oil. we'd be using them already. Less efficiency means lower standards of living, and can drive up other societal costs. Sure, it makes sense to do the common sense stuff, but if we increase the cost of energy by 20%, that cost gets embedded in nearly every product. That doesn't just mean fewer Gucci loafers fro the rich, it means less medicine for granny.
 
Back
Top Bottom