You are using an out of date browser. It may not display this or other websites correctly.
You should upgrade or use an alternative browser.
You should upgrade or use an alternative browser.
Profile: Computer Usage
- Thread starter imoldernu
- Start date
Fill in the blanks:
Computer.........%of usage......Mac......MS......Linux......Android......iOS
Desktop (3).........80%........................X
Laptop (1)........... 5%.....................................X
Tablet (2)............15%....................................................X
Phone (1).............5%....................................................X
Other: More computers: 1988 laptop win 95, 4 desktops... Windows 3.11, Windows XP, Windows Vista, Windows 7...and 3 old android tablets. All just for fun, and memory stimuli.
Comment:Must be easier ways to make a chart>
Last edited:
jfn111
Thinks s/he gets paid by the post
Wife uses the laptop.Fill in the blanks:
Computer ........%of usage......Mac.....MS......Linux.....Android.....iOS
Desktop (2) 80%..............................X
Laptop (1).......................................X
Tablet(1) 1%......................X
Phone(1) 19%......................X
Other:
Comment:
Last edited:
Meadbh
Give me a museum and I'll fill it. (Picasso) Give me a forum ...
- Joined
- Jul 22, 2006
- Messages
- 11,401
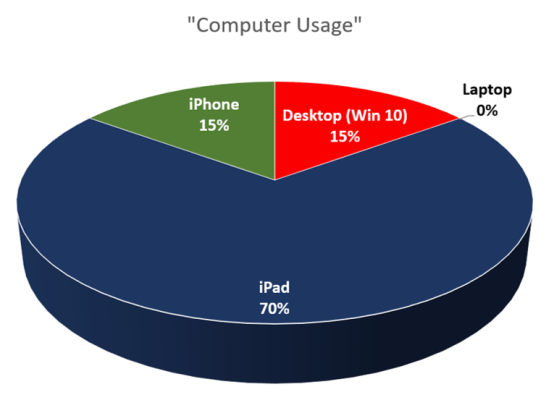
Desktop: 0%
Laptop (MacBook Air): 15%
Tablet (iPad): 80%
Phone (iPhone): 5%
I still have my old, dead 2003 Toshiba laptop with Windows 7. Must remove the motherboard and take it to the recycling centre soon!
Laptop (MacBook Air): 15%
Tablet (iPad): 80%
Phone (iPhone): 5%
I still have my old, dead 2003 Toshiba laptop with Windows 7. Must remove the motherboard and take it to the recycling centre soon!
Last edited:
rbmrtn
Thinks s/he gets paid by the post
Desktops 95%
Laptops < 5%
Tablet, Phone < 1%
Have many computers, vintage atari 800, XT clone, a DOS/Win3.11, Win98, XP, 7, 10, Sever2008, DecAlpha running OpenVMS, HP-UX workstation, HackinTosh ( OSX loaded on standard Intel box ), Linux
Mostly a linux user
Laptops < 5%
Tablet, Phone < 1%
Have many computers, vintage atari 800, XT clone, a DOS/Win3.11, Win98, XP, 7, 10, Sever2008, DecAlpha running OpenVMS, HP-UX workstation, HackinTosh ( OSX loaded on standard Intel box ), Linux
Mostly a linux user
Ronstar
Moderator Emeritus
Desktop (Mac) 40% (0% when away from home)
Laptop (Macbook) 10% (50% when away from home)
Tablet (Ipad) 40%
Phone (iPhone) 10%
Laptop (Macbook) 10% (50% when away from home)
Tablet (Ipad) 40%
Phone (iPhone) 10%
easysurfer
Give me a museum and I'll fill it. (Picasso) Give me a forum ...
- Joined
- Jun 11, 2008
- Messages
- 13,151
Computer.........%of usage......Mac......MS......Linux......Android.... ..iOS
Desktop (1).........90%........................X
Laptop (1)............3%.....................................X
Tablet (0).............0%.......................................................
Phone (1).............7%....................................................X
I usually use the desktop. Laptop and phone are for when traveling. Laptop pretty much used as a terminal to connect to the desktop. Recently traveling, used phone only since didn't need to "ET phone home" to the desktop.
Ronstar
Moderator Emeritus
Comment:Must be easier ways to make a chart>
ONLINE CHARTS | create and design your own charts and diagrams online | Graph
Attachments

Thanks... looks like a good site. Can't figure out how to make it work for this one, but watch for it in future posts....

Ronstar
Moderator Emeritus
Thanks... looks like a good site. Can't figure out how to make it work for this one, but watch for it in future posts....
You're welcome. There are a bunch of different options and it seems very customizable - fun to play with.
- Joined
- Oct 13, 2010
- Messages
- 10,735
Desktop | 3 | 60 |.| | X | | |
Laptop | 1 | 5 |.| | | | X |
Tablet | 1 | 5 |.| | | | X |
Phone | 1 | 30 |.| | | | X |
If you want to enter a table, copy this code, when you get into editing, select the A/A thing in the upper right corner, then paste and put a square bracket "[" in front of "TABLE]" and "/TABLE", fill in your data.
Code:
TABLE="head"]Computer Type|Count|Percent|.|Mac|MS|Linux|Android|iOS
Desktop                   |     |       |.|   |  |     |       |
Laptop                    |     |       |.|   |  |     |       |
Tablet                    |     |       |.|   |  |     |       |
Phone                     |     |       |.|   |  |     |       |
/TABLE][ TABLE...
^
and here on the last row:
[ /TABLE...
^
Attachments

Last edited:
HFWR
Give me a museum and I'll fill it. (Picasso) Give me a forum ...
Desktop: None
Laptop: Windoze 8.1
Tablet: iOS
Phone: iOS
Mostly use the tablet for surfing; laptop for data-entry tasks.
Laptop: Windoze 8.1
Tablet: iOS
Phone: iOS
Mostly use the tablet for surfing; laptop for data-entry tasks.
WhoDaresWins
Thinks s/he gets paid by the post
Desktop: None
Laptop: Macbook (90%)
Tablet: None
Phone: Samsung Galaxy S6 (10%)
Laptop: Macbook (90%)
Tablet: None
Phone: Samsung Galaxy S6 (10%)
Midpack
Give me a museum and I'll fill it. (Picasso) Give me a forum ...
FWIW, I believe my current desktop PC will be our last. My next "PC" will either be a laptop, an iMac, or (most likely) something plugged into an HDTV.
DW has a laptop if I ever need the convenience in the meantime, but hasn't been necessary in over a year - the iPad can do anything I need on the move.
DW has a laptop if I ever need the convenience in the meantime, but hasn't been necessary in over a year - the iPad can do anything I need on the move.
Attachments
Last edited:
kcowan
Give me a museum and I'll fill it. (Picasso) Give me a forum ...
Desktop | 0 | 0|.| | | | |
Laptop HP | 1 | 50 |.| | x | | |
Tablet iPad | 1 | 40 |.| | | | | x
Phone iPhone | 2| 10 |.| | | | | x
- Joined
- Jul 18, 2010
- Messages
- 7,947
Desktop | 1 | 1% |.| | x | | |
Laptop | 1 | 50% |.| x | | | |
Tablet | 1 | 19% |.| | | | | x
Phone | 1 | 30% |.| | | | | x
Desktop is DH's that I very rarely use.
Desktop | 3 | 80 |.| | x| | |
Laptop | 1 | 5 |.| | | x | |
Tablet | 2 | 15 |.| | | | x |
Phone | 1 | 5 |.| | | | x |
Yeah!!!!
Thanks, sengsational...
Am going to get a rep to present my new talents to GE...

http://www.ispot.tv/ad/AbyJ/general-electric-orc-o-gram
Last edited:
dixonge
Thinks s/he gets paid by the post
This is skewed by the fact that I'm still w*rking, but there will be ZERO desktops after next year. In the meantime...

frayne
Thinks s/he gets paid by the post
All Apple equipment;
Desktop 80%
Ipad 15%
Iphone 5%
On the road Macbook Air 100%
Desktop 80%
Ipad 15%
Iphone 5%
On the road Macbook Air 100%
Desktop | 0 |0 |.| | | | |
Laptop | 1 | 95 |.| | X | | |
Tablet | 0 | |.| | | | |
Phone | 1 | 5 |.| | | | X |
Only reason I haven't migrated to a tablet is I now watch/listen to all entertainment on the laptop. TV/stereo system gathering dust and will be given to charity soon.
sengsational, many thanks for your contribution of the table code!
Last edited: