Dtail
Give me a museum and I'll fill it. (Picasso) Give me a forum ...
What's the inflation rate?
Let's say 3% nominal return with a 2% inflation rate.
What's the inflation rate?
Andre Tobias once wrote "a luxury once sampled becomes a necessity." Hence, none of my spending is discretionary. I have to have all of this stuff.
At the risk of starting the first back-and-forth ER forum tirade of 2019, I do think this is where a SPIA can come into play by bringing some known stability as a foundation.
Variability over the long haul will exist for sure, but one can contain it to some extent by creating a base level of certainty. Obviously, there are return trade-offs that come along with this approach or similar approaches that rely more heavily on very safe fixed income securities.
OK everyone, let's be nice now...
At the risk of starting the first back-and-forth ER forum tirade of 2019, I do think this is where a SPIA can come into play by bringing some known stability as a foundation.

Cut-Throat said:Exactly! --- That is why you should Plan on variability... Withdrawal methods such as VPW, do exactly that. You cannot control variability, but you can react properly to it.
+1
Thanks for reminding me I need to calculate my withdrawal for 2019.
")
If I may ask - what is your discretionary expense as a % of total budgeted expenses?
Not the guy you asked, but we are planning on about 40% discretionary.
Me neither, but we're about 75% Discretionary..... Living in Hawaii this winter....
It’s been around half (after taxes), maybe a bit more these days,
Andre Tobias once wrote "a luxury once sampled becomes a necessity." Hence, none of my spending is discretionary. I have to have all of this stuff.
That has been one of my favorite quotes too.
Now, have you learned to stop sampling more luxuries?
+1
Thanks for reminding me I need to calculate my withdrawal for 2019.
I've been off work for the holidays, the weather has mostly been bad, so I've been playing with spreadsheets! Here's what I did:
Using historical returns for S&P 500, 1 yr T-Bill, 10 yr Bonds, and annual inflation rates I calculated the maximum inflation adjusted withdrawal rate that would result in zero remaining savings after 30 years, starting each year between 1928 and 1988. These are sequential calculations for each 30 year period, they are not randomly picked historical returns and inflation rates.
I used an asset allocation of 60% stocks, 10% T-Bills, and 30% Bonds.
The results are shown in the attached plot.
Some Statistics:
- The minimum successful withdrawal rate was exactly 4% (1966)
- The average successful withdrawal rate was 6.4% with a standard deviation of 1.7%
I'm interested in your thoughts and observations. Has anyone seen a similar analysis elsewhere?
Yes, and FIRECalc goes more than 50 years farther back, starting in 1871.
Just a question not a challenge (and a bit off topic) :
Maybe I don't understand the benefit of going back so far.
I wonder how relevant applying data from 1871 is in today's world.
Doesn't that possibly skew results one way or another? The 1800's were another planet economically.
Wouldn't using data from modern economic times, say, 1970 (or even 1930) forward give a more accurate picture?
..... For my scenario the toughest start years are pre 1926 and 1966 only comes in 12th worst or something like that.
Thanks! I will check it out.Take a look at the Simba Spreadsheet, available over on Bogleheads. It does what you did, and more. It has a large number of asset choices and it's maintained. A new update with 2018 results will be added in a few weeks.
The overview (which also contains a link to the post that contains a link to the spreadsheet itself. https://www.bogleheads.org/wiki/Simba's_backtesting_spreadsheet
I find it to be a fantastic resource and it's pretty easy to work with. It doesn't do variable withdrawals (the spreadsheet is big enough as it is). Like others have mentioned, a withdrawal method whose withdrawal has some connection to recent returns makes more sense to many of us. You are trading more certainty that your money will last as long as you need it to with the fact that the amount you withdraw will vary year upon year. VPW (also available on Bogleheads) and its variants, fixed percentage withdrawal, and Guyton-Klinger are among the many choices out there that do this. There are posts on this forum about it as well as over on Bogleheads.
Cheers
Big-Papa
Personally I’m glad those rougher earlier time periods are included in Firecalc. It increases my confidence in the model. After all we’re looking for worst case scenarios. For my scenario the toughest start years are pre 1926 and 1966 only comes in 12th worst or something like that.
At the risk of starting the first back-and-forth ER forum tirade of 2019, I do think this is where a SPIA can come into play by bringing some known stability as a foundation.
Variability over the long haul will exist for sure, but one can contain it to some extent by creating a base level of certainty. Obviously, there are return trade-offs that come along with this approach or similar approaches that rely more heavily on very safe fixed income securities.
OK everyone, let's be nice now...
I am always considering getting a 15 year period certain SPIA @ age 55 as a bridge to SS. I price one every once in a while to see what the equivalent interest rate is. Right now it sits @ 1.7% APR, which is less than 5 year CD's and less than a Vanguard MM fund, so I let it go. There are no mortality credits @ 55 (and no COLA) so it seems a better approach is a bond tent to get me to SS.
Can you explain that? I've always seen 1966 popping up as the worst start year in the database.
Does your scenario start off with low withdrawals in the early years or something?
-ERD50
it doesn’t give the order of which fails the fastest.the 5 worst failures were 1907,1929, 1937, 1965,1966.
I don’t think it is, although it’s often referenced.
I was running %remaining portfolio models with 50/50 total stock market and 5-year treasuries. Various withdrawal rates and hunting for worst year - largest portfolio drawdown - during a 30 year period.
Using Simba's spreadsheet from Bogleheads with 50% Total Stock Market and 50% Intermediate Treasuries yields the following for 30 year retirements using data starting in 1871 with 1966 still coming up as the worst year to have retired when using a fixed real % withdrawal (meaning this is the starting percentage for year 1 and is increased by the previous year's inflation rate each year)
1899: 4.2%
1906: 4.0%
1965: 4.0%
1966: 3.8%
1968: 3.9%
1969: 3.9%
All other years are higher than these.
Cheers,
Big-Papa
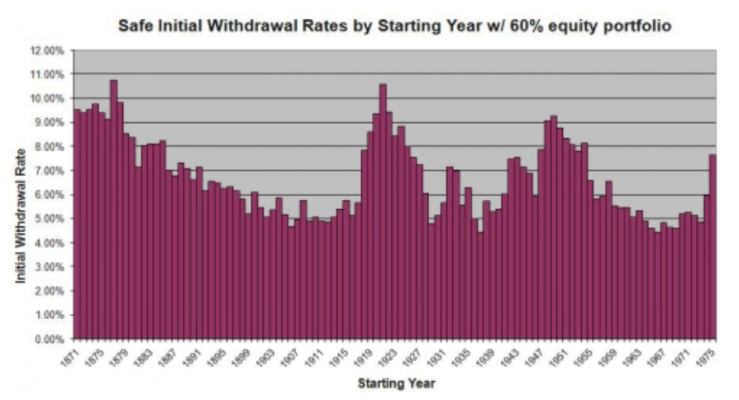
Kitces has this on his website, showing the 30 year SWR for a 60/40 AA beginning in 1871.
1937 and 1966 look very similar to me.
Also of interest, 87% of the time you would have been fine with a SWR of 5%.
Kitces has this on his website, showing the 30 year SWR for a 60/40 AA beginning in 1871.
1937 and 1966 look very similar to me.
Also of interest, 87% of the time you would have been fine with a SWR of 5%.