9-year fixed income plan

... Welcome to the world of, as Scott Adams says, "persuasion in a world where facts don't matter." ...
No, you guys still don't get it. You are focused on numerical investment facts and statistics in order to optimize total return. Sometimes there are very legitimate "outside" facts that drive people's behavior. In fact, the behavioral finance folks would tell you that is it most of the time or even all of the time.

Example: I eat a lot of foods and drink wines where the "facts" would say I shouldn't be doing that. I'm not interested in those facts and, in any event, they keep changing. Eggs were out and now they're in (right?). I've lost track of whether red wine is in or out. But regardless I don't care. My "facts" include wanting to enjoy life and eating good food (including bacon and --- gasp! --- foie gras!) is part of that.

Example: BIL and sis have their investments being managed by Thrivent. I consider this to be awful from a total return standpoint; I have seen some terrible portfolios from Thrivent. But even after sitting through my investment course and seeing the "facts" of stock-picking failure, they persist with Thrivent. Reason? Their "facts" include wanting to be completely hands-off and having an FA that they like.

Then, of course, all of us maximize-total-return folks only have "facts" learned from looking in the rear view mirror. We tend to forget that when self-rightously pounding the drum of passive investing. The future might prove our "facts" to be wrong.

OK, I'll stop trying to explain now.
 
If I own 100 shares each of two stocks in tax deferred accounts:

ABC pays 3% dividend each year, no growth
XYZ grows 3% each year, but no dividends

During accumulation phase, ABC dividends are reinvested and both stocks have similar value over N years because of compounding their returns.

However, in decumulation years where I spend those returns:

ABC provides a constant 3% payment each year...and I am happy.

XYZ requires me to sell 3 shares the first year to have money to spend, and then growth will be based on just 97 shares, reducing my future annual income by 3%...and this will continue to diminish each year...and I am NOT happy

I understand your point somewhat, as I invest for cash flow myself, not for total return. That's where I think the sticking point is in these [-]discussions[/-] debates that will never be resolved to anyone's satisfaction. I deliberately invest to maximize cash flow within the realm of risks that I'm comfortable with. My personal benchmark is whether or not annual cash flow increases each year. It does and has for the past several years I've been tracking it. My spreadsheet projections show this will continue after my husband retires, provided our annual cash flow exceeds our annual expenses. A byproduct of this is that our financial account balances will also continue to increase. Not growth in the traditional sense of investing for growth, but still valid.

I agree that it is vitally important to understand the differences and to know why you're investing the way you are. It sounds like you do. :)
 
Example: I eat a lot of foods and drink wines where the "facts" would say I shouldn't be doing that. I'm not interested in those facts and, in any event, they keep changing. Eggs were out and now they're in (right?). I've lost track of whether red wine is in or out. But regardless I don't care. My "facts" include wanting to enjoy life and eating good food (including bacon and --- gasp! --- foie gras!) is part of that.

Today for lunch I had eggs scrambled in bacon grease with sauteed onions and a sprinkling of bacon bits, followed by a smaller than normal piece of pecan pie. I'm feeling a hankering for some coffee right now. I think I'll go make some. :cool:
 
Then, of course, all of us maximize-total-return folks only have "facts" learned from looking in the rear view mirror. We tend to forget that when self-rightously pounding the drum of passive investing. The future might prove our "facts" to be wrong.

OK, I'll stop trying to explain now.[/QUOTE]

Great point. I really don't know why so many here hang their hat on past results. The past is not really all that indicative of future results. Who knows? Meanwhile I'll play the game I know and be satisfied with the results.
 
At any rate, once the data was questioned, I owned up to the mistake.

Indeed. Then I'm quite glad I noticed it and mentioned it.
 
Last edited:
... I really don't know why so many here hang their hat on past results. ...
Well, we necessarily live our lives by inductive reasoning. Sun coming up tomorrow morning? Well, it always has. Will we get killed driving to the grocery store? Well, we never have. The number of times we have driven to the grocery story has absolutely nothing to do with today's odds, but the more times we have done it the more comfortable we feel.

The good news is that inductive reasoning usually works or at least comes close. But in the investment world where we look back decades, one can't argue that the post-WWII investing environment was identical to the 1970s or to the Flash Boys world of the 21st century. In fact, Charles Ellis argues that the random walk that we believe in is a relatively new phenomenon. So, I use the data but secretly cross my fingers, too.
 
I am sorry, but your logic is very different from my experiences. The dividends are paid from profits, and the company decides how much that dividend will be. The ex-dividend price is a reflection of restrictions when buying the stock just before the dividend is paid...the ex-dividend pricing disappears after the dividend is paid. Net, the stock price does not remain ex-dividend as you have suggested.

While dividends are paid from profits. The company does not determine stock price, stock price is determined by the market, and normally paying a dividend is a positive influence on stock price, not the negative influence that you are suggesting.

The point was that your unhappiness with having less shares is nonsense.

Remember.... to make the comparison apples-to-apples, the assumption was that both stocks appreciate by 10% from the return on invested capital, but one pays 3% dividends and the other does not... so in the case of the non-dividend payer the company reinvests the profits rather than paying some of them out to shareholders and that compounded value is is reflected in the share price. Even if you run the numbers out 50 years, your never run out of shares as you seem to suggest because you sell less shares each year to generate the same cash flow as the dividend payer because the non-dividend payer's shares are worth more. You have less shares but the share price is higher because of higher equity of the investee.


Dividend payerNon-dividend payer
nsharesshare priceportfolio valuecash flowsharesshare priceportfolio valuecash flow
01,000.0010.0010,000.001,000.0010.0010,000.00
11,000.0010.6710,670.00330.00970.0011.0010,670.00330.00
21,000.0011.3811,384.89352.11940.9012.1011,384.89352.11
31,000.0012.1512,147.68375.70912.6713.3112,147.68375.70
41,000.0012.9612,961.57400.87885.2914.6412,961.57400.87
51,000.0013.8313,830.00427.73858.7316.1113,830.00427.73
61,000.0014.7614,756.61456.39832.9717.7214,756.61456.39
71,000.0015.7515,745.30486.97807.9819.4915,745.30486.97
81,000.0016.8016,800.23519.59783.7421.4416,800.23519.59
91,000.0017.9317,925.85554.41760.2323.5817,925.85554.41
101,000.0019.1319,126.88591.55737.4225.9419,126.88591.55
111,000.0020.4120,408.38631.19715.3028.5320,408.38631.19
121,000.0021.7821,775.75673.48693.8431.3821,775.75673.48
131,000.0023.2323,234.72718.60673.0334.5223,234.72718.60
141,000.0024.7924,791.45766.75652.8437.9724,791.45766.75
151,000.0026.4526,452.47818.12633.2541.7726,452.47818.12
161,000.0028.2228,224.79872.93614.2545.9528,224.79872.93
171,000.0030.1230,115.85931.42595.8350.5430,115.85931.42
181,000.0032.1332,133.61993.82577.9555.6032,133.61993.82
191,000.0034.2934,286.561,060.41560.6161.1634,286.561,060.41
201,000.0036.5836,583.761,131.46543.7967.2736,583.761,131.46
211,000.0039.0339,034.881,207.26527.4874.0039,034.881,207.26
221,000.0041.6541,650.211,288.15511.6681.4041,650.211,288.15
231,000.0044.4444,440.781,374.46496.3189.5444,440.781,374.46
241,000.0047.4247,418.311,466.55481.4298.5047,418.311,466.55
251,000.0050.6050,595.341,564.80466.97108.3550,595.341,564.80
261,000.0053.9953,985.221,669.65452.97119.1853,985.221,669.65
271,000.0057.6057,602.231,781.51439.38131.1057,602.231,781.51
281,000.0061.4661,461.581,900.87426.20144.2161,461.581,900.87
291,000.0065.5865,579.512,028.23413.41158.6365,579.512,028.23
301,000.0069.9769,973.342,164.12401.01174.4969,973.342,164.12
311,000.0074.6674,661.552,309.12388.98191.9474,661.552,309.12
321,000.0079.6679,663.872,463.83377.31211.1479,663.872,463.83
331,000.0085.0085,001.352,628.91365.99232.2585,001.352,628.91
341,000.0090.7090,696.442,805.04355.01255.4890,696.442,805.04
351,000.0096.7796,773.112,992.98344.36281.0296,773.112,992.98
361,000.00103.26103,256.903,193.51334.03309.13103,256.903,193.51
371,000.00110.18110,175.123,407.48324.01340.04110,175.123,407.48
381,000.00117.56117,556.853,635.78314.29374.04117,556.853,635.78
391,000.00125.43125,433.163,879.38304.86411.45125,433.163,879.38
401,000.00133.84133,837.184,139.29295.71452.59133,837.184,139.29
411,000.00142.80142,804.274,416.63286.84497.85142,804.274,416.63
421,000.00152.37152,372.164,712.54278.24547.64152,372.164,712.54
431,000.00162.58162,581.095,028.28269.89602.40162,581.095,028.28
441,000.00173.47173,474.025,365.18261.79662.64173,474.025,365.18
451,000.00185.10185,096.785,724.64253.94728.90185,096.785,724.64
461,000.00197.50197,498.276,108.19246.32801.80197,498.276,108.19
471,000.00210.73210,730.656,517.44238.93881.97210,730.656,517.44
481,000.00224.85224,849.616,954.11231.76970.17224,849.616,954.11
491,000.00239.91239,914.537,420.04224.811,067.19239,914.537,420.04
501,000.00255.99255,988.807,917.18218.071,173.91255,988.807,917.18
 
Last edited:
The pro div investors some how usually consider that div generators are the best of both worlds. Div stocks appreciate the same as non div stocks AND pay divs. I see it as no difference taking divs or reinvesting them and selling when you need some. It’s a wash. In my mind, it makes no difference, except for the tax consequences where div income MAY be advantageous. I’ve never read or compared where/what LTCG tax advantages are vs DIVIDEND tax advantages in net results.

Newbie question, but when looking at historical data on any stocks, doesn’t performance include divs? (Vs strickly stock price). I mean, the number of stocks/funds that pay no divs ever is small ( like B hathaway), so it is often easier (to me) for individual stocks to look at historical stock price plus div payout, rather than just price as more realistic. While funds are much easier to compare because divs are already included in the performance numbers. I find I have to really dig to find what historical distributions are for funds because that changes with turnovers, so I assume (?) that they are included in performance numbers, ie: always reinvested.
 
Last edited:
...

Newbie question, but when looking at historical data on any stocks, doesn’t performance include divs? (Vs strickly stock price). I mean, the number of stocks/funds that pay no divs ever is small ( like B hathaway), so it is often easier (to me) for individual stocks to look at historical stock price plus div payout, rather than just price as more realistic. While funds are much easier to compare because divs are already included in the performance numbers. I find I have to really dig to find what historical distributions are for funds because that changes with turnovers, so I assume (?) that they are included in performance numbers, ie: always reinvested.

Seems like the majority of charts (yahoo etc) show only stock/fund price (NAV), and do not include dividends.

A 'performance' chart should include the effect of reinvesting divs. Here are a couple that do:

http://bit.ly/2L5z2qQ < portfolio analyzer

https://stockcharts.com/freecharts/perf.php?SPY,vti,bnd,vbinx

I learned about both from posters on this forum.

-ERD50
 
The pro div investors some how usually consider that div generators are the best of both worlds. Div stocks appreciate the same as non div stocks AND pay divs. I see it as no difference taking divs or reinvesting them and selling when you need some. It’s a wash. ...

Back to the first part of your post:

If it were true that high dividend payers in general appreciated the same as non/low dividend payers, and paid a div n top of that, it would be foolish to not focus on high div payers. But there is no evidence that I've seen that this is true (other than the cherry-picked kind).

A company either distributes some of their wealth, or retains it. Both are reflected in it's share price. Either way, the value remains the same (all else being equal of course).

... In my mind, it makes no difference, except for the tax consequences where div income MAY be advantageous. I’ve never read or compared where/what LTCG tax advantages are vs DIVIDEND tax advantages in net results. ....

No, there's no difference between the tax treatment of LTCG and qualified divs. For MFJ:


If your taxable income is... The tax rate on qualified dividends is...
*Nonqualified dividends are taxed as ordinary income according to federal income tax brackets.

$0 to $78,750 0%
$78,751 to $488,850 15%
$488,851 or more 20%


Long-term capital gains tax rate Your income
* Short-term capital gains are taxed as ordinary income according to federal income tax brackets.
0% $0 to $78,750
15% $78,751 to $488,850
20% $488,851 or more


https://www.nerdwallet.com/blog/taxes/capital-gains-tax-rates/
https://www.nerdwallet.com/blog/taxes/dividend-tax-rate/

-ERD50
 
Seems like the majority of charts (yahoo etc) show only stock/fund price (NAV), and do not include dividends.

A 'performance' chart should include the effect of reinvesting divs. Here are a couple that do:...

+1 charts that chart share price don't include dividends but "growth of $10,000" charts do include dividends.

Portfolio Analyzer also includes dividends.
 
The pro div investors some how usually consider that div generators are the best of both worlds. Div stocks appreciate the same as non div stocks AND pay divs. I see it as no difference taking divs or reinvesting them and selling when you need some. It’s a wash. In my mind, it makes no difference, except for the tax consequences where div income MAY be advantageous. I’ve never read or compared where/what LTCG tax advantages are vs DIVIDEND tax advantages in net results.

One downside is dividend income is something you're forced to realize, even if you don't need it to meet current expenses, which could negatively impact qualifying for ACA tax credits for RE folks.
 
Last edited:
One downside is dividend income is something you're forced to realize, even if you don't need it to meet current expenses, which could negatively impact qualifying for ACA tax credits for RE folks.

Not only ACA credits. If you are trying to maximize ROTH conversions, or LTCG rates in the lower income brackets, divs cut into that. I started focusing on the lowest div payers I could find, with the total market being a little lower than something like SPY. Also a little BRK (0 divs), which I feel is very diversified, but I still don't want much of it overall.

-ERD50
 
A few short comments in defense of the dividend withdrawal method, and why I prefer it to the total return withdrawal method.

It comes down to information and accountability.

Dividends are set by the executives and the board of directors, and failing to pay a dividend has real world consequences. Who better to know what percentage of profits can be distributed to the shareholders than the executives and BOD? They are not pulling numbers out of thin air. Its based on the best possible data and projections that the company can make.

The total return method is determined by either a completely arbitrary amount or at best it is based on past historical information. It is not based on a fine grained study, looking at every single company in a portfolio individually, examining the most current data. This is not a withdrawal method where teams of accountants and finance people are pouring over the numbers and presenting a detailed report to the CEO and BOD with a recommendation (a recommendation which has real employment consequences for the people vouching for said data).

Furthermore the total return withdrawal method is subject to the irrational whims of the market, which often do not correspond to what individual companies are experiencing at the current time.

People can poo poo dividends all they want and claim they are a useless tax burden, yada yada yada. However, there is no question in my mind that the dividend withdrawal method is much safer and logical than the total return withdrawal method.
 
I owned some GE for a while when I was thinking that dividends were a good thing to chase. I don't own them anymore.
 
I owned some GE for a while when I was thinking that dividends were a good thing to chase. I don't own them anymore.


I recommend using funds/etfs to eliminate individual stock risk. For example VYM and VIG etfs.
 
If I own 100 shares each of two stocks in tax deferred accounts:

ABC pays 3% dividend each year, no growth
XYZ grows 3% each year, but no dividends

During accumulation phase, ABC dividends are reinvested and both stocks have similar value over N years because of compounding their returns.

However, in decumulation years where I spend those returns:

ABC provides a constant 3% payment each year...and I am happy.

XYZ requires me to sell 3 shares the first year to have money to spend, and then growth will be based on just 97 shares, reducing my future annual income by 3%...and this will continue to diminish each year...and I am NOT happy
Waiter? Check please...
 
A few short comments in defense of the dividend withdrawal method, and why I prefer it to the total return withdrawal method.

It comes down to information and accountability.

Dividends are set by the executives and the board of directors, and failing to pay a dividend has real world consequences. Who better to know what percentage of profits can be distributed to the shareholders than the executives and BOD? They are not pulling numbers out of thin air. Its based on the best possible data and projections that the company can make. ...

Well, the executives and BOD of CTL didn't seem to know, or they did know and did not inform the investors. Though I agree, there are consequences (CTL stock price). Even if they are upfront with what they know, if business is bad, they may need to cut divs. Knowledge alone doesn't protect a business form doing poorly. See this thread for more:

Any other CenturyLink (CTL) holders here? Wondering what you guys think of the dividend cut this week (from $2.16 to $1.00 annually), especially after management assured their investors multiple times in 2018 and even as recently as December (!) that they were "comfortable" with the existing dividend. .... .


I recommend using funds/etfs to eliminate individual stock risk. For example VYM and VIG etfs.

Sure, you should diversify to avoid single stock risk, but it still holds that using the "best possible data and projections that the company can make" doesn't assure success. And those same executives and BOD are predicting the future performance of the company, and divs can't be maintained w/o performance to back it up. That performance also drives the stock price. Where's the distinction?


... The total return method is determined by either a completely arbitrary amount or at best it is based on past historical information. It is not based on a fine grained study, looking at every single company in a portfolio individually, examining the most current data. This is not a withdrawal method where teams of accountants and finance people are pouring over the numbers and presenting a detailed report to the CEO and BOD with a recommendation (a recommendation which has real employment consequences for the people vouching for said data).

Furthermore the total return withdrawal method is subject to the irrational whims of the market, which often do not correspond to what individual companies are experiencing at the current time.

People can poo poo dividends all they want and claim they are a useless tax burden, yada yada yada. However, there is no question in my mind that the dividend withdrawal method is much safer and logical than the total return withdrawal method.

I won't "poo poo" dividends, but I will continue to evaluate these claims made by the high-div payer sector fans.

I fail to see how a "total return method" ( a term I disagree with anyhow - total return is just math, it is reality, it isn't a 'method', it is what you get from an investment) is any more/less arbitrary than selecting div payers. Regardless, if there was anything significant and actionable in what you say (which is all that matters), then we would see a clear advantage to your selections of VYM and VIG, over the 'arbitrary' selection of the Total Market (VTI).

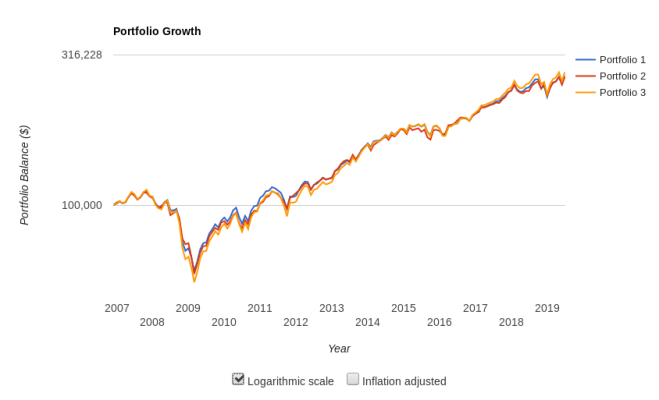
And yet, when I plug these into Portfolio Backtester, it shows that VTI outperforms a blend of VIG/VYM. And if I add in some bonds to make the performance about equal, the standard dev is very, very close.

Where's the advantage? Can you demonstrate the advantage, rather than just claim there is one? This isn't "poo-poo-ing" anything, it is letting the numbers talk.

http://bit.ly/2L7T9EL << short link

Port 1 = VTI /VBFMX 89.6/10.4
Port 2 = VYM/VIG 50/50
Port 3 = VTI 100%


-ERD50
 

Attachments

  • VTI-VIG-VYM.png
    VTI-VIG-VYM.png
    36.4 KB · Views: 18
Last edited:
... Dividends are set by the executives and the board of directors, and failing to pay a dividend has real world consequences. Who better to know what percentage of profits can be distributed to the shareholders than the executives and BOD? They are not pulling numbers out of thin air. Its based on the best possible data and projections that the company can make.

The total return method is determined by either a completely arbitrary amount or at best it is based on past historical information. It is not based on a fine grained study, looking at every single company in a portfolio individually, examining the most current data. This is not a withdrawal method where teams of accountants and finance people are pouring over the numbers and presenting a detailed report to the CEO and BOD with a recommendation (a recommendation which has real employment consequences for the people vouching for said data)...

Sorry, this is a very naive view of how the world works.

For example, there are many examples of companies continuing to pay dividends that they can't afford, even to the point of borrowing the money needed to do it. You cn also see this in the way dividends are cut --- usually it is dramatic. The reason for the drama is that these supposedly wise managers have been ignoring the need too long, trying to keep the stock price up rather than stanching the cash bleeding out to dividend recipients. Had they really been wise and prescient, the dividend would have been getting adjusted by small amounts and very frequently as the business waxed and waned.

Re total return, at its root it is probably based on the efficient market hypothesis though few of its advocates will be thinking of it that way. Re "fine grained study" I'm not sure who exactly is supposed to be doing this study, but no amount of studying a random process will produce reliable predictions. I think, though, that there is a tenable EMH + behavioral finance argument that the market's assessment of a stock's value is of better quality than management's decisions on dividend rates.
 
ERD50,

I use VYM. The single stock issues of CTL are irrelevant.

The correct benchmark for VYM is the value index. VYM outperforms its benchmark.

OldShooter,

Single stock issues, such as paying too much, are irrelevant as I use an index comprised of hundreds of companies.

I completely disagree that the stock market can put a value on a company with more precision than the companies employees can set the correct dividend policy. 100% disagree with you.
 
... OldShooter,

Single stock issues, such as paying too much, are irrelevant as I use an index comprised of hundreds of companies.

I completely disagree that the stock market can put a value on a company with more precision than the companies employees can set the correct dividend policy. 100% disagree with you.
No problem. My point was slightly different, though. Dividend rates are not set only based on the detailed economic analysis that you envision. They are set for reasons like stabilizing the stock price, "because that's what we did last quarter," "that;s what the street expects," and other non-economic reasons. The proof is simple: Despite quarterly and annual changes in the business' sales, profits, and balance sheet, dividends are typically held constant for long periods. And as I pointed out, dividends are not typically changed in the small increments that you would expect if they were strictly based on the current business situation.

And really, there is no "correct" dividend policy except what is determined in the rear view mirror. The view through the windshield is one of possibilities and probabilities, so there are lots of possible policies that might turn out to have been correct. It's educated guesswork, IOW, not science.

Just out of curiosity have you ever worked in management of a large public company? I have.
 
+1 IME dividend policy is probably more emotional than analytical. That is why you sometimes see a company's dividend stay the same despite declining earning until it gets to a breaking point and the company has no choice but to dramatically cut or eliminate dividends. Very little science involved.
 
Back
Top Bottom