Midpack
Give me a museum and I'll fill it. (Picasso) Give me a forum ...
With several threads on 4% SWR inflation adjusted withdrawal lately, I thought I'd start one on another well known approach, with a twist.
I'm starting to like remaining portfolio vs inflation adjusted more and more because a) the odds of running out of money or leaving a huge residual are greatly reduced and b) adjustments for real return fluctuations are automatic by comparison. Problem with a static remaining portfolio % is while withdrawing 4% at age 55 may be appropriate, it's unnecessarily conservative as the years pass - presumably you could safely withdraw more than 4% at age 95.
So I guess I could just guess and tweak the percentages as the decades pass, but my engineer brain just isn't wired that way...
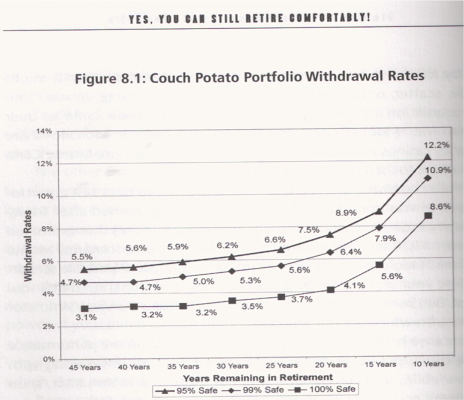
Where GRPWM = Graduated Remaining Portfolio Withdrawal Method. Yes I made it up the acronym, though I have to believe some scholar has written about something much like it. I'm borrowing the idea from the 1/N withdrawal method (actually more aggressive than GRPWM) and an old Stein-Demuth book (see book-chart inspiration below) that seems to be based on a Scott Burns lazy portfolio.
Method: So plan annual spending to fall (well) under the initial withdrawal rate (4-4.5%?), ignore returns, maybe reduce equity exposure with age, and withdraw from remaining portfolio as follows (for a strawperson):
Age|Withdrawal
50|5.5%
55|5.6%
60|5.9%
65|6.2%
70|6.6%
75|7.5%
80|8.9%
85|12.2%
90| " or use judgement!
I'm starting to like remaining portfolio vs inflation adjusted more and more because a) the odds of running out of money or leaving a huge residual are greatly reduced and b) adjustments for real return fluctuations are automatic by comparison. Problem with a static remaining portfolio % is while withdrawing 4% at age 55 may be appropriate, it's unnecessarily conservative as the years pass - presumably you could safely withdraw more than 4% at age 95.
So I guess I could just guess and tweak the percentages as the decades pass, but my engineer brain just isn't wired that way...
Where GRPWM = Graduated Remaining Portfolio Withdrawal Method. Yes I made it up the acronym, though I have to believe some scholar has written about something much like it. I'm borrowing the idea from the 1/N withdrawal method (actually more aggressive than GRPWM) and an old Stein-Demuth book (see book-chart inspiration below) that seems to be based on a Scott Burns lazy portfolio.
Method: So plan annual spending to fall (well) under the initial withdrawal rate (4-4.5%?), ignore returns, maybe reduce equity exposure with age, and withdraw from remaining portfolio as follows (for a strawperson):
50|5.5%
55|5.6%
60|5.9%
65|6.2%
70|6.6%
75|7.5%
80|8.9%
85|12.2%
90| " or use judgement!
") .
.