Alternative sources for daily portfolio position recaps

justplainbll

Recycles dryer sheets
Joined
Sep 30, 2011
Messages
414
Location
Easten Long Island
For the last 10 or so years, I've been downloading the symbols, closing prices, ttm earnings per share, annualized dividends per share, and ex-div dates for all (some 200+) of my equity and mutual fund holdings on a more or less daily basis from Yahoo-Finance. Because these positions are held in over a half dozen accounts, I find it helpful to generate a consolidated position recap report.
What might be some alternative sources for accessing and downloading the above described data to a delimited text file for upwards of 300 equity issues and mutual funds?
 
For the last 10 or so years, I've been downloading the symbols, closing prices, ttm earnings per share, annualized dividends per share, and ex-div dates for all (some 200+) of my equity and mutual fund holdings .... for upwards of 300 equity issues and mutual funds?
:eek:

Pray tell, what do you achieve with that many holdings? How do you deal with commissions, taxes? :confused:

I guess it's hard to even track them well enough to round to the nearest hundred. Is it 200+ or 300+ ?

Have you measured your after-tax, after-commission performance against something like the...

Vanguard S&P 500 Index Fund?

This is amazing. I've heard of people with dozens of MFs and maybe another dozens of stocks. But hundreds? Please fill us in on your thought process here.


-ERD50
 
:eek:

Pray tell, what do you achieve with that many holdings? How do you deal with commissions, taxes? :confused:

I guess it's hard to even track them well enough to round to the nearest hundred. Is it 200+ or 300+ ?

Have you measured your after-tax, after-commission performance against something like the...


This is amazing. I've heard of people with dozens of MFs and maybe another dozens of stocks. But hundreds? Please fill us in on your thought process here.


-ERD50
I began measuring my overall portfolio performance in earnest on 16 August 2002. As of 23 Sep. 2011 the portfolio market value consisted of 68% equity and a 31% mixture of fixed income and inverse funds. For the 475 weeks ending 9/23/11 the annualized return for the portfolio was 5.9%; equities were at 5.6% and the fixed income & inverse funds at 6.8%. As of 9/30 the 221 issue portfolio's YTD decline was 6.08%.
 
Last edited:
I began measuring my overall portfolio performance in earnest on 16 August 2002. As of 23 Sep. 2011 the portfolio market value consisted of 68% equity and a 31% mixture of fixed income and inverse funds. For the 475 weeks ending 9/23/11 the annualized return for the portfolio was 5.9%; equities were at 5.6% and the fixed income & inverse funds at 6.8%. As of 9/30 the 221 issue portfolio's YTD decline was 6.08%.
At what time on 9/30?

Why don't you get some portfolio tracking SW like Quicken? Probably help during tax prep as well...
 
Have you looked at Morningstar's Portfolio report? Once you put in all your holdings, it does the tracking. You can add and subtract columns to give you more info. I can't imagine needing more info that that, and we have pretty busy accounts too.
 
Thanks for the responses thus far. All I was asking about is an alternative daily delimited feed for the data I described above. I've developed my own software for performance analysis. The annualized appreciation of the value of my equity investments for the 476 weeks (through 9/30/2011) has exceeded the S&P 500 by 3.3%.
PS I watch about 300 issues but am currently invested in only 222.
 
Last edited:
Have you looked at Morningstar's Portfolio report? Once you put in all your holdings, it does the tracking. You can add and subtract columns to give you more info. I can't imagine needing more info that that, and we have pretty busy accounts too.
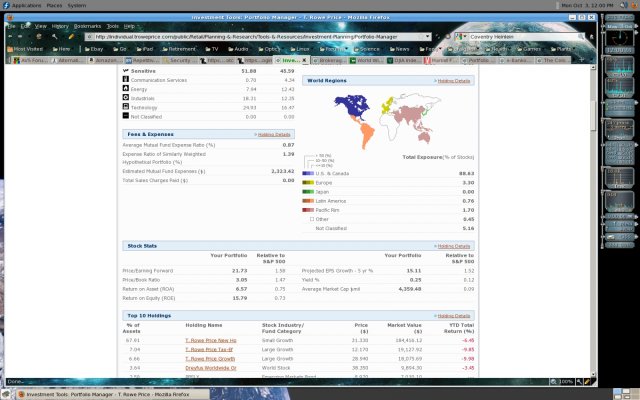
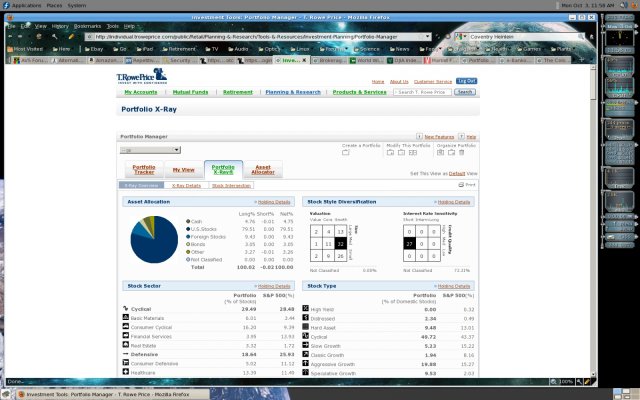
T. Rowe Price uses the Morningstar Portfolio report program. Here are a couple of screen pages from the "X-ray" option for my portfolio. I think it's pretty neat.
 

Attachments

  • snapshot2.jpg
    snapshot2.jpg
    397.8 KB · Views: 13
  • snapshot3.jpg
    snapshot3.jpg
    380.8 KB · Views: 9
I download all that Yahoo data directly into an Excel spreadsheet, either a push of one button or automatically every 2 minutes (guess what I do all day!) There's a way to load web pages directly to the spreadsheet. Not sure if you are doing that or not, but once set up it's easy. Table values will load nicely into cells so that you can look up a symbol on the downloaded web page and grab the price and other info you want. You can download your portfolio info if you save them on Yahoo, or I copy a report from Quicken into the same spreadsheet with all of my holdings. Heck I used to get real-time data from Yahoo for a real-time spreadsheet. Now I've mellowed out enough to use the free delayed quotes. And sometimes I don't even look at it for a few hours. Never know these days if things might drop 5% or something.
 
I began measuring my overall portfolio performance in earnest on 16 August 2002. As of 23 Sep. 2011 the portfolio market value consisted of 68% equity and a 31% mixture of fixed income and inverse funds. For the 475 weeks ending 9/23/11 the annualized return for the portfolio was 5.9%; equities were at 5.6% and the fixed income & inverse funds at 6.8%. As of 9/30 the 221 issue portfolio's YTD decline was 6.08%.

I hope I'm not coming across as negative, I'm just fascinated that someone would try to out-do an index by investing in so many equities. I've never heard of this approach.

Now, maybe I misinterpreted your math, or made some mistakes, but it appears to me that:

1) Your blend is roughly equivalent to some balanced funds (they probably would not do inverse investments, though some actively managed ones do).

2) If I take your 5.9% to mean "compounded annual return", and assume 147 weeks = 9.1346 years, then -

1.059 ^ 9.1346 = 1.6682 (66.82% increase)​

3) A well known balanced fund ( VWIAX - 'psssst-Wellesley') grew by 69.32% in that time.

VWIAX Historical Prices | VANGUARD WELLESLEY INCOME FD AD Stock - Yahoo! Finance

(see the 'Adj Close' to include divs and other distributions)


If my math/understanding of your numbers is correct, you seem to be doing a lot of work that Vanguard could be doing for you.

Cue unclemick.....

-ERD50
 
I download all that Yahoo data directly into an Excel spreadsheet, either a push of one button or automatically every 2 minutes (guess what I do all day!) There's a way to load web pages directly to the spreadsheet. Not sure if you are doing that or not, but once set up it's easy. Table values will load nicely into cells so that you can look up a symbol on the downloaded web page and grab the price and other info you want. You can download your portfolio info if you save them on Yahoo, or I copy a report from Quicken into the same spreadsheet with all of my holdings. Heck I used to get real-time data from Yahoo for a real-time spreadsheet. Now I've mellowed out enough to use the free delayed quotes. And sometimes I don't even look at it for a few hours. Never know these days if things might drop 5% or something.
I also use Yahoo. My original question was prompted by the possibility that sometime in the future Yahoo's information might cease to be freely available.
 
I hope I'm not coming across as negative, I'm just fascinated that someone would try to out-do an index by investing in so many equities. I've never heard of this approach.

Now, maybe I misinterpreted your math, or made some mistakes, but it appears to me that:

1) Your blend is roughly equivalent to some balanced funds (they probably would not do inverse investments, though some actively managed ones do).

2) If I take your 5.9% to mean "compounded annual return", and assume 147 weeks = 9.1346 years, then -
1.059 ^ 9.1346 = 1.6682 (66.82% increase)​
3) A well known balanced fund ( VWIAX - 'psssst-Wellesley') grew by 69.32% in that time.

VWIAX Historical Prices | VANGUARD WELLESLEY INCOME FD AD Stock - Yahoo! Finance

(see the 'Adj Close' to include divs and other distributions)


If my math/understanding of your numbers is correct, you seem to be doing a lot of work that Vanguard could be doing for you.

Cue unclemick.....

-ERD50
Pretty close ERD:

TOTAL RETURNS SINCE 8/16/02 (exclusive of September 2011 dividends)
# Weeks Date_ Equity Total Portfolio
474 ___ 09/16 75.7% 76.6%
475 ___ 09/23 63.8% 69.2%
476 ___ 09/30 65.0% 67.7%
The Vanguard Wellesley Income Fund's Admiral shares indeed have done nicely. However it is my understanding that their asset mix runs about 40% equity and 60% fixed income. My median target mix with assets at brokers and mutual funds is about 65% equity and 35% fixed income.
 
Last edited:
Pretty close ERD:

TOTAL RETURNS SINCE 8/16/02 (exclusive of September 2011 dividends)
# Weeks Date_ Equity Total Portfolio
474 ___ 09/16 75.7% 76.6%
475 ___ 09/23 63.8% 69.2%
476 ___ 09/30 65.0% 67.7%
The Vanguard Wellesley Income Fund's Admiral shares indeed have done nicely. However it is my understanding that their asset mix runs about 40% equity and 60% fixed income. My median target mix with assets at brokers and mutual funds is about 65% equity and 35% fixed income.

OK, so the next thing would be to compare volatility. Or maybe bull/bear markets.

I also tend to lean to a more aggressive AA than Wellesley, but that is based on indexes for each. IF you have selected a mix of more conservative and/or div paying stocks, the end result may actually 'look' more like 40%/60%?

I assume you want a higher eq ratio for long term growth (I do), but I wonder if you will get it with that particular mix of stocks? The bull/bear time period comparisons might help you determine that.

-ERD50
 
My greatest concern is the erosion of the dollar's purchasing power. That has plagued this country for the greater part of its history.
Too many fools out there who think they'd be on easy street if the minimum wage was raised to $100 per hour or their monthly SS benefit was raised to $7,000.
 
Last edited:
My median target mix with assets at brokers and mutual funds is about 65% equity and 35% fixed income.
That AA closely matches Vanguard Wellington (VWENX) which has an expense ratio of 0.22%.

Of course the big question with that move would be what to do with all your free time...
 
That AA closely matches Vanguard Wellington (VWENX) which has an expense ratio of 0.22%.
Wellington fund since 8/16/02 +86.5% according to M*
 

Attachments

  • wellington.jpg
    wellington.jpg
    53.5 KB · Views: 11
That AA closely matches Vanguard Wellington (VWENX) which has an expense ratio of 0.22%.

Wellington fund since 8/16/02 +86.5% according to M*

Looks like we have a WINNUH!

Using adjusted closes from Yahoo (for consistency with previous numbers), I got a 78.6% return for Wellington, from 08/16/02 - 09/23/11. Not sure why the difference, but it appears to beat the OPs numbers in either case.

-ERD50
 
Last edited:
Looks like we have a WINNUH!

Using adjusted closes from Yahoo (for consistency with previous numbers), I got a 78.6% return for Wellington, from 08/16/02 - 09/23/11. Not sure why the difference, but it appears to beat the OPs numbers in either case.

-ERD50
Right. I said 08/16/02 but the chart reads 08/31/02. M* charts does that sometimes... Going back and plugging in your dates I get $10K grows to $17789. That's 77.9% and that's close enough for me.
 
Looks like we have a WINNUH!

Using adjusted closes from Yahoo (for consistency with previous numbers), I got a 78.6% return for Wellington, from 08/16/02 - 09/23/11. Not sure why the difference, but it appears to beat the OPs numbers in either case.

-ERD50
May well be a winner but I'm down 8.5% from my 6/20/11 purchase of the poor boy's version of Wellington (VWELX)
 
I also use Yahoo. My original question was prompted by the possibility that sometime in the future Yahoo's information might cease to be freely available.

I've done the same thing with Microsoft and Google finance web pages when Yahoo looked flakey. Load the web data on one tab, use a second to format it into a standard table for your spreadsheet, and then the rest of the spreadsheet uses the standard table. If you need to switch, you just need to change the standard table's references to the web data. The rest stays the same.

As to your original question then, I have used Google and Microsoft, though Yahoo has remained the most useful for me. Google had some real-time data for some ETF's but didn't have all the data I wanted. It was also more complex dealing with some real-time data and some delayed data. Microsoft was similarly data poor or hard to load I think, though it's been a while.
 
Back
Top Bottom