Am I understanding SWR correctly?

accountingsucks

Recycles dryer sheets
Joined
Jan 28, 2006
Messages
346
I am planning to have a 3% withdrawal rate and after tax expenses of $40K. This would imply i need $1.32 Million. Now, with 2% inflation, my expenses rise $800 per year but at say 10% tax bracket I need another $80 for taxes for $880 total. $880X33 means i need to build my portfolio from year 1 by $29040 just to keep up with inflation.

So to account for both the inflation growth plus my $40K annual spend, I would need $40000+29040 = 69040/1320000 = 5.2% total return on my portfolio assuming I never intend to draw down principal which is what I am aiming for.

Am I missing something? Seems abit of a lofty expectation given a 60/40 portfolio. I guess withdrawal rates contemplate you drawing down the balance over time but my preference is not to do that until I get Canadian pension in my mid 60's.
 
The common approach here is to include taxes in your spending.
 
The 4% rule generally takes inflation into account assuming a balanced portfolio returning say 6-7%. At 3% you're even more conservative.
 
The common approach here is to include taxes in your spending.
+1

So, you really need $1.48 million to generate $44,400 in the first year at a 3% withdrawal rate.

And, yes, you'd need to earn about 5% per year (nominal) to cover 2% inflation, 3% withdrawals, and end with an inflation-adjusted $1.48 million.

BUT, the SWR acronym typically is not used for plans that assume level earnings rates. It refers to a plan that allows for a wide variety of investment returns, in which you are willing to spend principal in bad investment scenarios, and consider ending with $1 "success".
 
Last edited:
The 4% rule generally takes inflation into account assuming a balanced portfolio returning say 6-7%. At 3% you're even more conservative.

nope this is not what it represents.


the 4% rule assumes no specific average return since averages don't mean a thing when spending down.

what it really means is that looking at the worst possible time frames in history that statistically you would have at least a 90% chance of not running out of money over 30 years drawing out 4% inflation adjusted assuming at least 40% equities .

it assumes no average annual return needed as sequence risk determines your outcome.

it all boils down to to whatever the markets annual returns , interest rates and inflation net out to each year the average real return over the first 15 years of a 30 year period can't fall below 2% real return according to michael kitces research.

i-cjrvftJ-X3.jpg
 
Last edited:
I'd suggest you read Bengen's paper on Safe Withdrawal Rates. It is really important to internalize what SWR means. (Or you risk waking up in a cold sweat one night after you've given up your cushy job :)

http://www.retailinvestor.org/pdf/Bengen1.pdf

In addition to what mathjak107 says, there is an implicit requirement of equity holdings of between 40-70% and the rest in a bond index fund.

There are other methods to arrive at an SWR, but "traditionally" this is the method people refer to.

An important caveat to keep in mind is that Bengen's study (and many others) assume that the equity portion is in US stocks. Being in Canada, the whole equation may be different for you. But the concepts will be the same.


All the best.
 
I am planning to have a 3% withdrawal rate and after tax expenses of $40K. This would imply i need $1.32 Million. Now, with 2% inflation, my expenses rise $800 per year but at say 10% tax bracket I need another $80 for taxes for $880 total. $880X33 means i need to build my portfolio from year 1 by $29040 just to keep up with inflation.

So to account for both the inflation growth plus my $40K annual spend, I would need $40000+29040 = 69040/1320000 = 5.2% total return on my portfolio assuming I never intend to draw down principal which is what I am aiming for.

Am I missing something? Seems abit of a lofty expectation given a 60/40 portfolio. I guess withdrawal rates contemplate you drawing down the balance over time but my preference is not to do that until I get Canadian pension in my mid 60's.

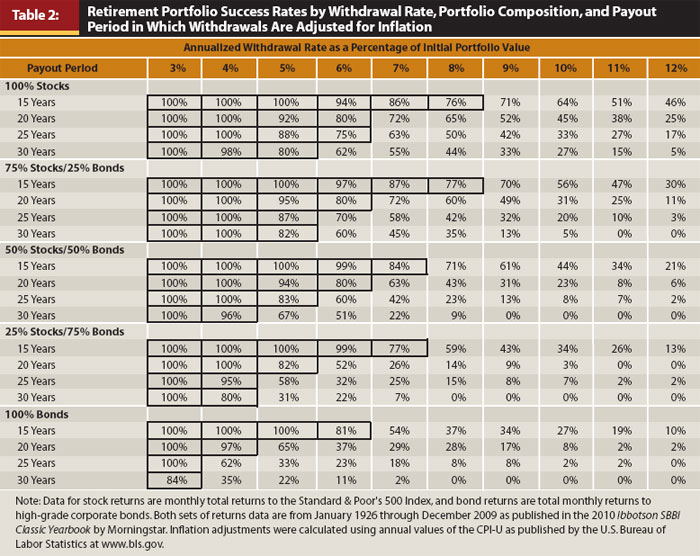
I think you are confusing two concepts.

1. The SWR research has been done on the assumption that it is acceptable to consume principal. The only way not to consume principal is to have a portfolio that generates consistent income and/or dividends that are sufficient to pay your living expenses and taxes, while maintaining capital. If you are withdrawing all dividends and income from a securities portfolio, you are relying on capital growth alone to keep up with inflation over the decades. A large, well chosen and diversified property portfolio would be another way to produce inflation-protected income while increasing in value (over several property cycles). Either way, you need a bigger portfolio if you don't intend to decrease the principal.

2. If you are using FireCalc to estimate your portfolio performance, you need to include estimated taxes in your WR. That's just how the program works. Taxes have a huge effect on the total withdrawal you need, particularly if you have large tax sheltered accounts (read RRSPs) which are subject to RMDs after a certain age.

FireCalc, remember, is based on historical performance of US markets. While the TSX has historically performed well, it has not generated the same returns. Of course there are no guarantees going forward.
 
I am planning to have a 3% withdrawal rate and after tax expenses of $40K. This would imply i need $1.32 Million. Now, with 2% inflation, my expenses rise $800 per year but at say 10% tax bracket I need another $80 for taxes for $880 total. $880X33 means i need to build my portfolio from year 1 by $29040 just to keep up with inflation.

So to account for both the inflation growth plus my $40K annual spend, I would need $40000+29040 = 69040/1320000 = 5.2% total return on my portfolio assuming I never intend to draw down principal which is what I am aiming for.

Am I missing something? Seems abit of a lofty expectation given a 60/40 portfolio. I guess withdrawal rates contemplate you drawing down the balance over time but my preference is not to do that until I get Canadian pension in my mid 60's.

Yes, You are missing a couple of key points.

1.) SWR was based on Worst Case Conditions of Market History. Worst Case for a 30 year retirement was about 3.75%. You are are already 'undershooting' that by aiming at 3%.

2.) SWR rates were also based on consuming principal, which is logical since when you are dead, the principle will not do you any good. Leaving an estate to someone is a completely different topic.

You are not talking about SWR in the conventional sense. You are talking about a completely different retirement plan. A retirement plan that may have you working well into your 80s to succeed.
 
Usually taxes would be included in your living expenses so your nestegg would need to be 10% more, but... depending on the composition of your investments between taxable/tax-deferred/tax-free and stocks/bonds your taxes might be quite a bit less than 10%. you can get an idea by doing a hypothetical tax return using Taxcaster.
 
You can get an idea by doing a hypothetical tax return using Taxcaster.

Actually, Taxcaster would not be applicable as it is a US based program and the OP lives in Alberta, Canada. (The app is even unavailable for download in Canada). A better resource for Canadians is the tax calculator(s) on

TaxTips.ca - The Facts on Tax for Canadians
 
Good point :facepalm:... I saw the Canadian pension thing but thought perhaps it was from a prior job and that the OP was in the US. Same principle applies though... do a hypothetical return and include that cost in your expenses. Given OP is Canadian, 10% may not be enough. :D
 
the 4% rule assumes no specific average return since averages don't mean a thing when spending down.

it assumes no average annual return needed as sequence risk determines your outcome.

[/IMG]

MathJack, without getting too technical/mathematical, can you expand/explain what you mean here? I'm not sure what "sequence risk" means.
 
Good point :facepalm:... I saw the Canadian pension thing but thought perhaps it was from a prior job and that the OP was in the US. Same principle applies though... do a hypothetical return and include that cost in your expenses. Given OP is Canadian, 10% may not be enough. :D

HAHA. Actually in Alberta they just bumped up tax rates - mind you, based on my projected living costs down the road i would fall under the new thresholds.

In CAnada dividends are tax free up to about 65K of total income. So my 10% tax payable is actually on the high side. Will be more around 5% and primarily due to strategic RRSP withdrawals as I want to avoid higher taxes in my 70's when it becomes a mandatory annual withdrawal at a pretty steep percentage

I use taxtips.ca which every Canuck should be familiar with
 
MathJack, without getting too technical/mathematical, can you expand/explain what you mean here? I'm not sure what "sequence risk" means.

DR MOSHE MILEVSKY wrote a very interesting paper a few years ago , RETIREMENT RUIN AND THE SEQUENCE OF RETURNS.

he took an example of a constant 7% return year after year based on a 7% average return over 30 years and drew 7% or 950 a month out starting at age 65 . the money was exhausted by age 86. this is typical of what uninformed folks do in an excell spread sheet or reverse amortization calculator when they have to enter a growth rate so they use an average.

next he took the same 7% average return and made it happen in different orders.

he made year 1 up 7% ,year 2 minus -13% and year 3 up 27% and repeated that pattern . the same 7% average return went broke at 83.


again , same 7% average return ,making the first year up 7% , next year up 27% and 3rd year minus -13%. you went broke at age 90. your money lasted 7 years longer than the example above with the same 7% average return.


next he did first year minus -13% , 2nd year up 7% and 3rd year up 27% . you were broke by 81.

that is also the same 7% average return

lastly he made 1st year up 27% ,2nd up 7% and 3rd year down 13% , same 7% average return and you lasted until 95.

that is almost 10 years longer than just figuring a constant 7% year after year ,.

the variation on the same 7% average return in how long your money will last is largely controlled by the order of those gains and losses.

in this case the same 7% average return most folks just throw in an excell spreadsheet and spend down didn't last until 86.5 like the spread sheet said. they went broke based on the order of that 7% average anywhere from 81 to 95.

as you see being down early on can drastically reduce your failure age by a lot even though the average return over time is identical. it isn't just the sequence of returns that has this effect ,it is the sequence of inflation too. now you have the two working against each other as well altering outcomes even more.
 
HAHA. Actually in Alberta they just bumped up tax rates - mind you, based on my projected living costs down the road i would fall under the new thresholds.

In CAnada dividends are tax free up to about 65K of total income. So my 10% tax payable is actually on the high side. Will be more around 5% and primarily due to strategic RRSP withdrawals as I want to avoid higher taxes in my 70's when it becomes a mandatory annual withdrawal at a pretty steep percentage

I use taxtips.ca which every Canuck should be familiar with

I am doing strategic RRSP withdrawals too. It's the best way to stay out of the higher tax brackets after age 71.
 
Thanks MathJack!

Very interesting. Makes perfect sense after thinking about it; a few down early years means you'll be starting from a smaller start point etc. I just didn't know there was a name for it.
 
DR MOSHE MILEVSKY wrote a very interesting paper a few years ago , RETIREMENT RUIN AND THE SEQUENCE OF RETURNS.

he took an example of a constant 7% return year after year based on a 7% average return over 30 years and drew 7% or 950 a month out starting at age 65 . the money was exhausted by age 86. this is typical of what uninformed folks do in an excell spread sheet or reverse amortization calculator when they have to enter a growth rate so they use an average.

next he took the same 7% average return and made it happen in different orders.

he made year 1 up 7% ,year 2 minus -13% and year 3 up 27% and repeated that pattern . the same 7% average return went broke at 83.


again , same 7% average return ,making the first year up 7% , next year up 27% and 3rd year minus -13%. you went broke at age 90. your money lasted 7 years longer than the example above with the same 7% average return.


next he did first year minus -13% , 2nd year up 7% and 3rd year up 27% . you were broke by 81.

that is also the same 7% average return

lastly he made 1st year up 27% ,2nd up 7% and 3rd year down 13% , same 7% average return and you lasted until 95.

that is almost 10 years longer than just figuring a constant 7% year after year ,.

the variation on the same 7% average return in how long your money will last is largely controlled by the order of those gains and losses.

in this case the same 7% average return most folks just throw in an excell spreadsheet and spend down didn't last until 86.5 like the spread sheet said. they went broke based on the order of that 7% average anywhere from 81 to 95.

as you see being down early on can drastically reduce your failure age by a lot even though the average return over time is identical. it isn't just the sequence of returns that has this effect ,it is the sequence of inflation too. now you have the two working against each other as well altering outcomes even more.

Excellent information! And I imagine it is similar in reverse for inflation. If (assuming the same average inflation rate) you are fortunate to have lower inflation during your first years of retirement you'd fare better than if you started out with higher inflation rates,
 
Perhaps it is but inflation is typically in a tighter range than investment returns so the likelihood of an adverse sequence of inflation being calamitous isn't very high... besides, bond returns tend to be positively correlated to inflation and a good portion of most retiree's portfoilios are fixed income investments.
 
mathjak107 said:
what it really means is that looking at the worst possible time frames in history that statistically you would have at least a 90% chance of not running out of money over 30 years drawing out 4% inflation adjusted assuming at least 40% equities .

I thought that the 90% reflected your statistical chance of not running out of money looking at all historical time frames, not just the worst possible ones. Is that wrong? Does FIRECALC look at the actual sequence of historical returns, or randomly re-sequenced historical returns?
 
I thought that the 90% reflected your statistical chance of not running out of money looking at all historical time frames, not just the worst possible ones. Is that wrong? Does FIRECALC look at the actual sequence of historical returns, or randomly re-sequenced historical returns?

firecalc uses actual data in sequence. the 4% rule is based on the worst of times we had in actual order of how they played out. the fidelity RIP calculator uses monte carlo. i prefer monte carlo myself since over lapping time frames may never ever play out that way again as they did in historical.

case in point is where we stand today . never before have low interest rates and high stock valuations existed in our historical data as it played out

did you know if we removed the two worst time frames the swr would have been a 6.50% average ?


https://www.kitces.com/blog/what-returns-are-safe-withdrawal-rates-really-based-upon/
 
Last edited:
I use Monte Carlo myself as well. Who's to say that what has happened is the only thing that can happen? On the other hand, random combinations and sequences do fail to catch the economic controls or tendencies behind what actually has happened. I wish I were smart enough to build those tendencies into my Monte Carlo combinations.

What you mean, I think, is that the 4% SWR result stems from what did happen during the worst time periods, but that the overall analysis includes all time frames.
 
the over all analysis used all time frames just so they could identify the worst time frames. then withdrawal rates were tested until a safe level was found with a high level of successfully not running out of money over 30 years.

it is those worst of times the 4% rule is based on.
 
Last edited:
Right. But without all those good periods in addition to the worst ones, FireCalc wouldn't be able to estimate the "chance of success" of any withdrawal rate/investment scenario.

Edit: okay, I see you weren't talking specificaly about FireCalc in your first post. Still, to define a SWR as having a 90% POS, the full population of results (or at least the bottom 11%) has to be known.
 
Last edited:

Latest posts

Back
Top Bottom