Another Interesting Retirement Calculator

Midpack

Give me a museum and I'll fill it. (Picasso) Give me a forum ...
Joined
Jan 21, 2008
Messages
21,321
Location
NC
Not unlike FIRECALC in that it’s based on history. It doesn’t have all the bells & whistles that FIRECALC does, and the output graph takes a little getting used to - but it:
  • displays instantly
  • you can add a “Spending Flexibility %” which I find useful
  • you can factor in a tax rate! and
  • if you hover over the graph it displays lots of probability detail.
Being able to reduce spending if needed, and quantifying how much flexibility you might need is a good exercise IMO.

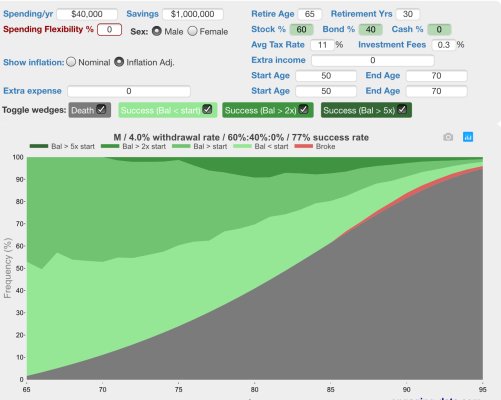
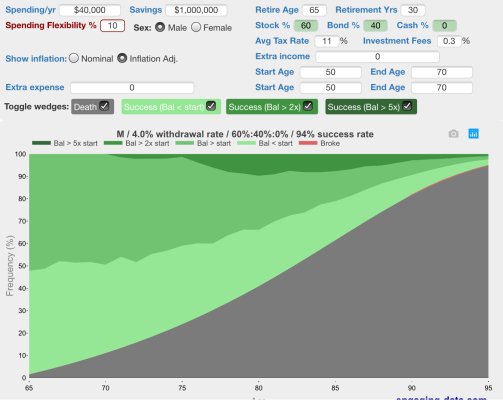
Note the example below with an 11% tax rate. With no spending flexibility success rate was 77%. With just 10% spending flexibility the success rate jumps to 94%.

Spending Flexibility = Percentage of your annual spending that you could reduce when portfolio balance is lower than your initial balance. This only applies when your portfolio balance is lower than your initial balance (on an inflation-adjusted basis).

https://engaging-data.com/will-money-last-retire-early/
 

Attachments

  • D9D37712-43DC-4699-ABFA-5C88AF69A1B9.jpeg
    D9D37712-43DC-4699-ABFA-5C88AF69A1B9.jpeg
    403.2 KB · Views: 214
  • E11BDCBC-5250-4BC5-AB11-0AE31F0B08CE.jpeg
    E11BDCBC-5250-4BC5-AB11-0AE31F0B08CE.jpeg
    402.1 KB · Views: 188
Last edited:
Well, that was fun! Thanks! Given that I'm newly RE'd, and still trying to convince my self and my DW that we are actually FI -- This is a nice alternative look to FIRECalc. Near as I can tell, we'll be ok ;-)
 
"One of the key takeaways from this is how large the ‘Wedge of Death’ gets as you get older and how the likelihood of dying is much higher than running out of money."

I think turning that off initially is a good idea.
 
For me there is little difference between 20% and 100% equities.
 
"One of the key takeaways from this is how large the ‘Wedge of Death’ gets as you get older and how the likelihood of dying is much higher than running out of money."

I think turning that off initially is a good idea.
That is a peculiar feature isn't it. I assume it's because the author is keen on showing probabilities, and reminding us we might go poof before plan end? Nice that you CAN turn it off.
 
I disagree. Keeping the probability of death active visualizes something we all know but actively do not acknowledge.
The Reaper is waiting. You do not have to plan for eternity.
 
What I meant, is that the death "feature" overwhelms the view of other indicators. Of course it is always in play, so it worth looking at, but it obscures the financial picture.
 
"One of the key takeaways from this is how large the ‘Wedge of Death’ gets as you get older and how the likelihood of dying is much higher than running out of money."

I think turning that off initially is a good idea.

The growth in the "wedge" is a strikingly vivid graphical representation of why we aspire to FIRE. We are all getting closer to the end and so how do we choose to spend our remaining time?

My FIL used a tape measure to demonstrate the same concept. At a family gathering, he pulled a tape measure out and stretched it out to 74", which he said was a man's expected life span. He was 72 at the time. See how little I have left he said. Ironically, he died two years later in his sleep and was still working at the time - out of necessity.
 
I recall seeing this one before... likely from an ER post. It was ok to look at, but lost interest with it.
 
I recall seeing this one before... likely from an ER post. It was ok to look at, but lost interest with it.

Agree I have seen it before. Either here or at Boglehead's.
 
I think the biggest benefit to this one is it CLEARY visualizes “life is short”. Maybe make it a required exercise for all OMYers?
 
I believe the wedge of death was intentional by the author, otherwise it is basically doing the same thing as firecalc. There is a thread over on Mr Money Mustache where the author takes enhancement requests. (He hasn't done the one I'd like to see where the wedge shows the likelihood of death of husband, wife, and both.)

It is fascinating to see how much more likely it is that I'm dead than broke at various points for even a much higher spending level than a 4% WR.
 
"The wedge of death" is a rather dramatic phrase. It sounds like a nail-biting ride in an amusement park!
 
I like the wedge of death.

With my data, I have about a 0% chance of running out of money in the next 30 years. I have IIRC about a 20% chance of death.

I can make this actionable by taking some of my money, buying a gym membership, and exercising regularly. Which is exactly what I did.

I can also spend more time and attention caring for my health (which needs it) and a little less time and attention on my money (which is on autopilot more and more these days).
 
What I meant, is that the death "feature" overwhelms the view of other indicators. Of course it is always in play, so it worth looking at, but it obscures the financial picture.


Well, the "big picture" by necessity obscures the "smaller picture". :)

Anyone notices that the red wedge, that risk of running out of money, gets thicker in the middle, then thins out at the end?

It means you are more likely to run out of money at 90 than at 95. Wait a minute! Once you are broke at 90, you will remain broke at 95, right? :)

Such fallacy could be the quirk of the FIRECalc-like use of real life data. For a long run, there's not enough data to cover bad periods, and the artifact is that you have better chance of financing a 30-year retirement than you do a 25-year one.

I think it is just the odds of death overwhelming the other ones. If you toggle them off you see the expected shapes on the curves.
 
I think it is just the odds of death overwhelming the other ones. If you toggle them off you see the expected shapes on the curves.

I stand corrected.

The growth of death risk eventually swamps out the risk of being broke, giving rise to a "big picture" that I am not accustomed to see.

It is definitely a good visual to awaken us to a real peril that we often chose to ignore.
 
One more reason to...

Blow That Dough!
 
^^^ Sounds reasonable to me. Now, how much dough should we blow?

I went to the calculator, kept everything default, but changed the starting age to 60 to represent many people here, and changed the 4% WR to 9% WR.

Whoo Wee! In 20 years, at 80 years of age, the risk of bankruptcy is now equal the risk of death. That should be enough, yes?

And posters here who are older than 60 can go to a lot higher WR yet.
 
This isn't new. CCCA over at MMM posted this tool well over a year ago. He's added some features since it first came out that weren't in the original version, such as being able to add additional income like SS beginning at a later date, which made the tool much better for my use.

As for the "overwhelming" death wedge, that's the point. And if you don't want to see it, it takes one click to remove it from the graphic.

Anyway, just one more confirmation that retiring in my mid 50's at 4% WR should work out just fine with a conservative AA even if my SS benefit @65 gets a 25% haircut from the currently calculated benefit.
 
Last edited:
This isn't new. CCCA over at MMM posted this tool well over a year ago. He's added some features since it first came out that weren't in the original version, such as being able to add additional income like SS beginning at a later date, which made is much better for my use.
Who said it was new? Just not referenced here often if at all...
 
OK. So perhaps I do not want to add the worry of bankruptcy to make it equal the risk of death at 80. I don't think dying rich is that bad, compared to dying poor.

But then, I recall that by delaying SS to 70, I can survive on that and will not be homeless, even if I totally spend down my stash.

So, what does 9% WR gives me in dollar amount? Whoo Wee again. That's a lot of money, considering that my last 12-month WR is less than 3%. It's 2.6% to be exact.
 
So, what does 9% WR gives me in dollar amount? Whoo Wee again. That's a lot of money, considering that my last 12-month WR is less than 3%. It's 2.6% to be exact.

Well, with that WR you can buy the BIG RV and hire a full time driver! :dance:
 
Back
Top Bottom