Approximately how much will my investment portfolio decline when bull market ends?

nico08

Recycles dryer sheets
Joined
Feb 6, 2010
Messages
429
Hi.

I am just looking for a guestimate. If I have an 80% stock / 20% bond portfolio, about what percentage of a decrease can I expect to occur in the total value of my investment portfolio when the bull market ends?

Am I correct in understanding that the end of a bull market consistently leads to a decrease in the value of a stock oriented investment portfolio?

Can the beta value of an investment portfolio be used to predict the amount of decrease that may occur at the end of a bull market? If beta is not relevant, is there another value that may help with the prediction.

I am just trying to estimate the range of loss my investment portfolio may experience at the end of a bull market.
 
A typical 80/20 portfolio may have lost 35-40% of its value in the last (severe) bear market of 2008-09. That was a worse-than-average bear market by a considerable degree, but it could always be worse (such as the drop from 1929 to 1932).

There is no way to accurately quantify what kind of loss you'll see in the next bear market because none of us know. And if we did know, we'd become extremely wealthy... and wouldn't reveal the secret!
 
Last edited:
According to this information from Vanguard the worst annual return of a 80/20 portfolio was a 34.9% loss in 1931.

See https://personal.vanguard.com/us/insights/saving-investing/model-portfolio-allocations

Since the OP asked how much his portfolio could decline "when bull market ends", I think the above information could be unintentionally misleading.

Markets can decline for multiple years so the annual decline numbers may not spell out the potential for larger losses. For example, over the 18 month period from Oct 2007 to April 2009 the market declined by ~50%. As a point of reference, my 45/55 portfolio declined 36% so an 80/20 portfolio would have very likely experienced a decline of 40%+.
 
As a point of reference, my 45/55 portfolio declined 36% so an 80/20 portfolio would have very likely experienced a decline of 40%+.

In reality, it depends a LOT on whether the bond portion was primarily in corporates or Treasuries. Corporates got whacked hard in that bear market but Treasuries performed exceptionally well.
 
I understand that there is no way to ascertain a certain/exact percent decrease, but you and others have given me a better understanding of the possible range of the decrease, so I appreciate that.
 
I understand that there is no way to ascertain a certain/exact percent decrease, but you and others have given me a better understanding of the possible range of the decrease, so I appreciate that.

You are to be commended for thinking about the range of decrease and preparing in the event that such a crash should occur again.

One of the computations that I like to do each year, is to figure out the percentage of my withdrawal relative to my portfolio's value at its lowest (in March, 2009). That gives me more confidence in my ability to survive a similar crash, if/when that occurs.

Of course, there could always be an even worse crash, but I know from experience that I can live on a lot less than I have been spending in retirement. So, some major belt-tightening would be my immediate response to an even worse crash.
 
I hope you are thinking long term with an 80/20 allocation.

I'm closer to 50/50 and stuck to my approach to only rebalance once a year (in Jan) and can't wait to get that over with considering such a good year in equities.
 
Since the OP asked how much his portfolio could decline "when bull market ends", I think the above information could be unintentionally misleading.

Markets can decline for multiple years so the annual decline numbers may not spell out the potential for larger losses. For example, over the 18 month period from Oct 2007 to April 2009 the market declined by ~50%. As a point of reference, my 45/55 portfolio declined 36% so an 80/20 portfolio would have very likely experienced a decline of 40%+.

While I don't disagree with the essence of your post, given that the OP isn't a total newbie I think that the OP would realize that there could be more than one year with a loss. Happens all the time. That is why I was specific when I said "annual" loss.
 
In reality, it depends a LOT on whether the bond portion was primarily in corporates or Treasuries. Corporates got whacked hard in that bear market but Treasuries performed exceptionally well.
+1

Yes, there were many variables impacting the decline of individual portfolios. And the asset class performance during the next big decline will almost certainly not be the same as the last - other than the common denominator of extremely painful to those of us in the decumulation stage.
 
While I don't disagree with the essence of your post, given that the OP isn't a total newbie I think that the OP would realize that there could be more than one year with a loss. Happens all the time. That is why I was specific when I said "annual" loss.

While I do understand the OP has some investing knowledge, there are thousands of folks reading this forum, many with little or no investing experience. That's my reason for pointing out the max annual decline in the Vanguard illustration wasn't necessarily the largest hit history has seen for an 80/20 portfolio.
 
With an 80/20 port you should expect to lose 40% of your port's value without panicking and be able to coolly rebalance back to 80/20.

If not, dial back the equities.
 
+1

Yes, there were many variables impacting the decline of individual portfolios. And the asset class performance during the next big decline will almost certainly not be the same as the last - other than the common denominator of extremely painful to those of us in the decumulation stage.

I seem to recall all correlations running to 1.0 in the recent Great Recession; diversification provided no protection.

Edit to add link to correlation matrices (see Table I and II)

http://www.rinehartwealthmanagement.com/pdf/hybrid_newsletter.pdf
 
Last edited:
Between Jan 2008 and June of 2009, the value of my IRA investment (there were no withdrawal or additions during the period) declined by 33%. The AA started out as 70/30 and probably hit 80/20 as I sold my 10 year TIPs bonds at a considerable profit during the period.

The value of my all liquid assets declined by 22% My overall portfolio started off probably 80/20. (I just realized I should include my AA when I record my periodic balance sheet calculations).

It is also important to note that from the March 2009 lows to June 2009, SPY went from 68 to 92. So I didn't capture the worse by any means.

For planning purposes I assume the 2008 crisis will be the worse of my life. In someways it was worse than the depression (example housing price declines).
I am assuming the next bear market will be a garden variety one 30% so 80% * 30% decline = 24%. The beta on my portfolio is under one so I am hoping the loss will be 20-25%
 
This link will give you historical worst/best case scenario on diff AA:
Portfolio allocation models
Very good info, showing the higher the equity AA the better average return, but at the price of higher volatility. It's exactly as we have been taught to expect.

It should be noted that, as shown, the worst annual loss for each AA is measured from Jan 1st to Jan 1st. Unless the investor only looks at his portfolio only once per year, he will note the highest watermark and mourns the loss when his portfolio hits bottom somewhere between the annual marks.

For example, the site above shows that the highest annual loss of the 100% equity portfolio is -43% in 1931. In the recent Great Recession, the S&P500 lost 55% from its top in late 2007 to the bottom in early 2009.

The above Web page shows that a 50/50 portfolio worst year return was -22.5% also in 1931. Before an investor says "Hey, that's not too bad and I can take it", he should be reminded that we have had 2 or 3 bad consecutive years in the past.

Have I scared anyone yet? :cool:
 
The you for the precise quote, I will base my retirement on it ha ha.
 
"Have I scared anyone yet? :cool:" Yes - I'm going to cash everything and have a mattress made from all the quarters... *grin*
 
I'm not scared at all. Our port was actually up in 1987 because we hung on.

2000-2002 were very scary because our port lost value three years on a row. I felt sick rebalancing into stocks watching our portfolio's value melt away.

We started 2008 with a 60/40 port. In 2009 we over rebalanced to 70/30.

Nope. Not scared. 30 years of investing. 3 very scary market meltdowns.
 
I seem to recall all correlations running to 1.0 in the recent Great Recession; diversification provided no protection.

Edit to add link to correlation matrices (see Table I and II)

http://www.rinehartwealthmanagement.com/pdf/hybrid_newsletter.pdf
Not correct. Cash did fine, and Treasuries gained in value. High quality bond funds like VBISX did well.

It's a good example of not ignoring cash as an asset class which I note the newsletter omitted. 2008 was a great example of how having cash gives you money to rebalance with when a bunch of your other assets have been clobbered.
 
Last edited:
You are to be commended for thinking about the range of decrease and preparing in the event that such a crash should occur again.

One of the computations that I like to do each year, is to figure out the percentage of my withdrawal relative to my portfolio's value at its lowest (in March, 2009). That gives me more confidence in my ability to survive a similar crash, if/when that occurs.

Of course, there could always be an even worse crash, but I know from experience that I can live on a lot less than I have been spending in retirement. So, some major belt-tightening would be my immediate response to an even worse crash.
+1

I do the same what-if benchmarking. Assume my current 53/47 portfolio takes the same hit it experienced in 2008, -27.5%, after withdrawal and see how much that cuts my next year withdrawal (which is a percentage of the total portfolio value every Jan 1).
 
Last edited:
Approximately how much will my investment portfolio decline when bull market ...

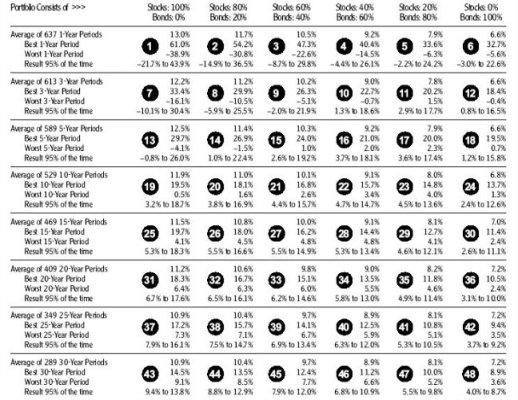
I've seen these charts of past history several times, just one example...answers for everyone!

[edit: These are annualized returns. Nice to note worst case returns turn positive in 5-10 years for all but the most extreme asset allocations. Past performance is no guarantee of future results]
 

Attachments

  • image.jpg
    image.jpg
    160.4 KB · Views: 56
Last edited:
Back
Top Bottom