I read it as "the correlation of Bogle's predicted equity returns and the actual equity returns has been 0.81". Which would be pretty good agreement, I.e. his predictions have been relatively accurate.This quote from the article does not make any sense to me. Correlation of what to what? Such high correlations seems to indicate he is correlating a time series, which of course you cannot do. Maybe I am missing something?
You are using an out of date browser. It may not display this or other websites correctly.
You should upgrade or use an alternative browser.
You should upgrade or use an alternative browser.
Bogle's 10-Year Forecast
- Thread starter misanman
- Start date
mathjak107
Give me a museum and I'll fill it. (Picasso) Give me a forum ...
- Joined
- Jul 27, 2005
- Messages
- 6,204
There are two events, the 2000 crash and the 2008 crash. It's hard to say what specific steps people took. I am guessing anybody who has assets in the market and sees the market drop by 50% is going to change his or her spending behavior.
I re-read the article and understood it as follows:
if they increased their 2000 spending by inflation every year, then starting from a $1million portfolio in 2000, they would still have $900,000 today.
But the reality is that they did NOT increase their spending every year, so they would have more than $900,000 today.
On the lack of spending increases with inflation, this pretty much matches what the Bureau of Labor Statistics reports, although one cannot assume people had money to spend and didn't; maybe they had no money to spend and therefore spending went down.
This thread is about Mr Bogle and his 10-year estimate. I don't know if I got off-topic; I just wanted to end the day on a happy note.
all study's are like results in the lab . they rule out human inter-action so there is a consistent comparison .
human intervention can make results better so once again we are considering worst case not only based on market data but on human intervention as well . in this case pulling 4% and inflation adjusting like a robot .
NW-Bound
Give me a museum and I'll fill it. (Picasso) Give me a forum ...
- Joined
- Jul 3, 2008
- Messages
- 35,712
Apologies in advance if the article in the link below has been posted already here, but it was a new article to me on the same subject and addresses the question of how accurate have Bogle's forecasts been in the past:
Bogle: Stocks 6%, Bonds 3%
"Formally, the relationship between Bogle's 10-year stock forecasts and subsequent market returns is 0.81. The even-simpler bond model has an even-higher correlation of 0.95, illustrating once again that with investment projections, less can be more. (Greater complexity does not necessarily mean greater sophistication; as Mark Twain wrote, sometimes people compose long letters because they lack the time--and perhaps the skill--to draft a short one.)
Thus, the evidence suggests that while Bogle's forecasts aren't reliable guides for a single, specified time period, they will likely be close to the mark over a sufficiently long term."
Thanks for posting.
A stock return of 6% nominal, and perhaps 3.5% after inflation of 2.5% is still a lot better than fixed income. So why not go 100% equity?
Of course the market does not move in a straight line, so I am going to have some cash or bond for rebalancing opportunity. Or if one goes 100% stock, he can write some calls when he feels the market is frothy.
A lot of the above depends on the execution. Some say that you cannot do that reliably, but I do not see it as the reason to not do anything. It requires that you make an evaluation of the market, and if you believe that you cannot evaluate the market, you will not make a prediction of what its future return is going to be. Right?
daylatedollarshort
Give me a museum and I'll fill it. (Picasso) Give me a forum ...
- Joined
- Feb 19, 2013
- Messages
- 9,358
Thanks for posting.
A stock return of 6% nominal, and perhaps 3.5% after inflation of 2.5% is still a lot better than fixed income. So why not go 100% equity?
That is certainly a valid choice for people like you who understand the risks, can withstand the ups and downs or even profit from them and and won't be eating cat food no matter what the market does.
Last edited:
Because of the volatility.A stock return of 6% nominal, and perhaps 3.5% after inflation of 2.5% is still a lot better than fixed income. So why not go 100% equity?
Did Bogle give us annualized returns or just annual. The latter, I think. The annualized rates can (and probably will) be lower because of the volatility. We use fixed income not only for return but also to dampen the impact of market declines and to have some funds to "buy low".
eta2020
Thinks s/he gets paid by the post
- Joined
- Sep 13, 2013
- Messages
- 1,248
Thanks for posting.
A stock return of 6% nominal, and perhaps 3.5% after inflation of 2.5% is still a lot better than fixed income. So why not go 100% equity?
It requires portfolio of size that most people do not have. IE of size where one can comfortably live of off dividends.
And even in such case it is good to have few % in cash for emergencies.
NW-Bound
Give me a museum and I'll fill it. (Picasso) Give me a forum ...
- Joined
- Jul 3, 2008
- Messages
- 35,712
Living entirely off dividends means your stash will last forever. However the 4% WR rule or FIRECalc results presume that a retiree will liquidate his portfolio and withdraw part of the principal as needed. Solvency until death is the objective, and not principal conservation. If one wants to maintain his principal, he definitely needs a larger stash.It requires portfolio of size that most people do not have. IE of size where one can comfortably live of off dividends...
daylatedollarshort
Give me a museum and I'll fill it. (Picasso) Give me a forum ...
- Joined
- Feb 19, 2013
- Messages
- 9,358
Living entirely off dividends means your stash will last forever....If one wants to maintain his principal, he definitely needs a larger stash.
Or low overhead and maybe some hobby income. We're not big risk takers so that's our long term plan.
mathjak107
Give me a museum and I'll fill it. (Picasso) Give me a forum ...
- Joined
- Jul 27, 2005
- Messages
- 6,204
Living entirely off dividends means your stash will last forever. However the 4% WR rule or FIRECalc results presume that a retiree will liquidate his portfolio and withdraw part of the principal as needed. Solvency until death is the objective, and not principal conservation. If one wants to maintain his principal, he definitely needs a larger stash.
as we saw in 2008 dividends get slashed , stopped and suspended at the worsat times . many times even when they are not they fail at keeping up with your own personal cost of living and expenses ,
that means making up short falls from principal so betting the ranch on just living off dividends only , rarely works out that way .
eta2020
Thinks s/he gets paid by the post
- Joined
- Sep 13, 2013
- Messages
- 1,248
as we saw in 2008 dividends get slashed , stopped and suspended at the worsat times . many times even when they are not they fail at keeping up with your own personal cost of living and expenses ,
that means making up short falls from principal so betting the ranch on just living off dividends only , rarely works out that way .
S&P 500 Dividend by Year
Yea less than 24% decrease at its worst. I think one would survive it for 2 years.
mathjak107
Give me a museum and I'll fill it. (Picasso) Give me a forum ...
- Joined
- Jul 27, 2005
- Messages
- 6,204
no one knows how long the next "good " downturn will last " making a plan based on driving and looking in the rear view mirror not a great idea . you need to have a comprhensive plan in place that allows for the spending of principal and not just the fact you will always survive on dividends .
Mulligan
Give me a museum and I'll fill it. (Picasso) Give me a forum ...
- Joined
- May 3, 2009
- Messages
- 9,343
no one knows how long the next "good " downturn will last " making a plan based on driving and looking in the rear view mirror not a great idea . you need to have a comprhensive plan in place that allows for the spending of principal and not just the fact you will always survive on dividends .
One thing I admire about you Mathjack. You are 100% consistent, constant, and unyielding in your advocacy of "total return" and your viewpoint on dividends. And I see no fallacy in your thinking.
But there is an intelligent opposing view in investing for income in retirement without the main source coming from common stock dividends.
Sent from my iPad using Tapatalk
eta2020
Thinks s/he gets paid by the post
- Joined
- Sep 13, 2013
- Messages
- 1,248
no one knows how long the next "good " downturn will last " making a plan based on driving and looking in the rear view mirror not a great idea . you need to have a comprhensive plan in place that allows for the spending of principal and not just the fact you will always survive on dividends .
That is one good rear view mirror
")
Because if I look at data from 1871 till today I would only have problems with 2 years 1917 and 1931. Looks like good bet to me.
For great majority of time dividends grow faster then inflation. So I would in fact have more real money each year. That table I provided is in inflation adjusted real money.
I am not arguing that such approach will not require LOT of money but will also result in extreme simplicity. Investing can be as simple or as difficult as we choose. Simplicity fits me well.
Last edited:
I suppose a dividend investor could take any dividend growth beyond inflation and put it into an account for the "down years." But, then that invested money would become "principal" and therefore verboten and entirely off limits for any kind of spending. So, to the dividend-only "true believer" the money must be spent in the year received, no "smoothing" with an extra pot allowed else risk violating the rules (or getting into some mental gymnastics over why >this< dividend money is different from dividend money received before retirement).For great majority of time dividends grow faster then inflation. So I would in fact have more real money each year. That table I provided is in inflation adjusted real money.
The arbitrary "fencing" of money in a dividend-only outlook would be very restrictive, for me. If my dividends were cut by 25% but my portfolio were much larger in real terms than when I started investing, I would definitely dive into that "bigger than when I started" pile of money to keep comfortable. That's what the money is for, and if that bigger pile of money is insufficient (at some later point in my retirement), then I truly had no business retiring in the first place. But, we all get to make our own choices.
Last edited:
eta2020
Thinks s/he gets paid by the post
- Joined
- Sep 13, 2013
- Messages
- 1,248
Yes the complete fencing is not efficient for numerous reasons.
Like what if you retire at 50 and can not touch 1-2 million in IRA's and 401k's? How do you get to dividend yield from that pile?
How do you withdraw in such way so you can get Obamacare Subsidies? (At least some years). How do you handle minimal withdrawals from 401k's and IRA's after you are 70?
But if you treat Roth accounts, IRA's, 410k's, brokerage accounts as one big pile from which you spend dividend generated by entire pile it can kinda be done.....
daylatedollarshort
Give me a museum and I'll fill it. (Picasso) Give me a forum ...
- Joined
- Feb 19, 2013
- Messages
- 9,358
Also, if I'm not allowed to look into the rear view mirror as an indication of what might lie ahead, there is hardly anything to go on.
Too much fog in the front windshield ..
If you are using Firecalc, I think the question to ask yourself is 100 years of U.S. investing history a large enough dataset to be able to be able to predict the next 50 years with a 100% confidence factor? Can you predict the results of a third flip of a coin based on the results of the previous two flips?
The Triumph of the Optimists authors looked across 16 countries to try to get a bigger dataset:
“Equities continue to have an important role in long-term portfolios. However, their prospective returns are lower than the performance that many investors project, while their risk is higher than many investors appreciate. Investors who assume that favorable equity returns can be relied on in the long term or that stocks are safe so long as they are held for 20 years are optimists. Their optimism is irrational.”
Last edited:
target2019
Give me a museum and I'll fill it. (Picasso) Give me a forum ...
Random thoughts. Pun intended. Coin flips are not equivalent to market results. The next coin flip knows nothing of previous coin flips.
pb4uski
Give me a museum and I'll fill it. (Picasso) Give me a forum ...
If you are using Firecalc, I think the question to ask yourself is 100 years of U.S. investing history a large enough dataset to be able to be able to predict the next 50 years with a 100% confidence factor? Can you predict the results of a third flip of a coin based on the results of the previous two flips? ....
If you have 100 years of data you have 50 fifty year periods, not two.
Sent from my SAMSUNG-SGH-I777 using Early Retirement Forum mobile app
Wow, what a depressing article. That said, for a lot of folks, what are the alternatives? Cash? TIPS?“Equities continue to have an important role in long-term portfolios. However, their prospective returns are lower than the performance that many investors project, while their risk is higher than many investors appreciate. Investors who assume that favorable equity returns can be relied on in the long term or that stocks are safe so long as they are held for 20 years are optimists. Their optimism is irrational.”
I'm choosing to be optimistic but conservative in my estimates. While a 6% real return might be too optimistic, using negative to 0% return just seems too depressing. I'm using 3% real for my projections otherwise, I might just stay out of the market altogether.
Last edited:
Aeowyn
Recycles dryer sheets
I think I'll take some comfort in the Bogle stock return predictions based on how conservative they have historically been. I took the graph below from the Boglehead's Conference 15 October 2015 page 19 (http://johncbogle.com/wordpress/wp-content/uploads/2015/10/Bogleheads-14-2015.pdf). I added the red line which would represent where the Bogle prediction was equal to the actual return. The vast majority of 10 year returns exceed the Bogle prediction by quite a bit.
I assume the black line that is in the graph represents a linear fit to the data points. That tells me on average a Bogle prediction of 6% should generate an actual return of ~11%. Sounds good to me - also sounds in line with historical average returns. Even after allowing for 4% for inflation and fees, that still gets a real investor return of 7%. So I'm not quite sure why Bogle is so outraged about pensions using 7% as their growth estimate.
I assume the black line that is in the graph represents a linear fit to the data points. That tells me on average a Bogle prediction of 6% should generate an actual return of ~11%. Sounds good to me - also sounds in line with historical average returns. Even after allowing for 4% for inflation and fees, that still gets a real investor return of 7%. So I'm not quite sure why Bogle is so outraged about pensions using 7% as their growth estimate.
Attachments
NW-Bound
Give me a museum and I'll fill it. (Picasso) Give me a forum ...
- Joined
- Jul 3, 2008
- Messages
- 35,712
Alternatives are worse. That's why Bogle said one needs to stay invested.Wow, what a depressing article. That said, for a lot of folks, what are the alternatives? Cash? TIPS?
Who said negative to zero return? Bogle said 6% nominal, unless we have P/E reversion then it would be less.I'm choosing to be optimistic but conservative in my estimates. While a 6% real return might be too optimistic, using negative to 0% return just seems too depressing. I'm using 3% real for my projections otherwise, I might just stay out of the market altogether.
Aeowyn
Recycles dryer sheets
Who said negative to zero return? Bogle said 6% nominal, unless we have P/E reversion then it would be less.
Bogle did. 6% is the gross stock return. If you have 50/50 stock/bond portfolio gross return is 4.5% Then after subtracting 2% for inflation, either 1.5% (active fund costs) or 0.05% (index fund costs), 1.5% for investor behavior, and 0.5% for taxes....
Last edited:
photoguy
Thinks s/he gets paid by the post
- Joined
- Jun 15, 2010
- Messages
- 2,301
I found the paper where bogle actually describes his methodology used to generate graph posted above: An Error Occurred Setting Your User Cookie It's behind a paywall but available free with a trial registration.
To answer my earlier questions in this thread about how he generated his numbers, he uses the initial dividend yield and trailing 10 year average for earnings growth. His also assumes that P/E will revert to the prior 30-year average.
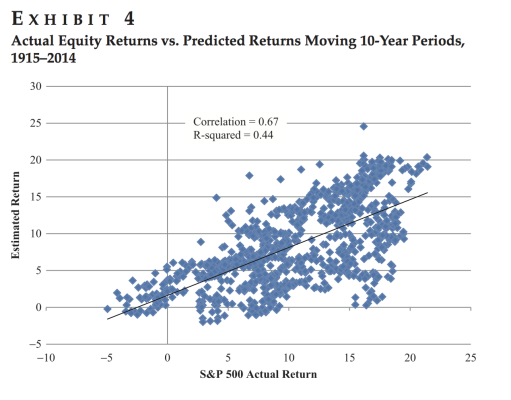
I will note that he used rolling windows on a monthly basis. I think monthly is poor choice as this greatly inflates the number of data points on the graph and makes his model seem much stronger than can be justified statistically (because of the heavy amount of overlap, the data points on the graph aren't anywhere near independent, etc. etc.).
In his paper, he also redoes his experiment from 1915-2015. Here he obtains an R^2 = 0.44 which is much lower but inline with experimental results for Schiller PE10. I can buy that Bogle's model is roughly as good as Schiller PE but I had hard time accepting an R^2 of 0.65 (which I think is too good to be true).
If you look at Bogle's graph for a bigger dataset (1915-2014) you can see that this relationship no longer holds and a Bogle prediction of 6% yields an actual return centered around 6%. The problem is that 1990-2014 is such a short time period that you can get a lot of noise and spurious results.
To answer my earlier questions in this thread about how he generated his numbers, he uses the initial dividend yield and trailing 10 year average for earnings growth. His also assumes that P/E will revert to the prior 30-year average.
I will note that he used rolling windows on a monthly basis. I think monthly is poor choice as this greatly inflates the number of data points on the graph and makes his model seem much stronger than can be justified statistically (because of the heavy amount of overlap, the data points on the graph aren't anywhere near independent, etc. etc.).
In his paper, he also redoes his experiment from 1915-2015. Here he obtains an R^2 = 0.44 which is much lower but inline with experimental results for Schiller PE10. I can buy that Bogle's model is roughly as good as Schiller PE but I had hard time accepting an R^2 of 0.65 (which I think is too good to be true).
I assume the black line that is in the graph represents a linear fit to the data points. That tells me on average a Bogle prediction of 6% should generate an actual return of ~11%.
If you look at Bogle's graph for a bigger dataset (1915-2014) you can see that this relationship no longer holds and a Bogle prediction of 6% yields an actual return centered around 6%. The problem is that 1990-2014 is such a short time period that you can get a lot of noise and spurious results.
Attachments
NW-Bound
Give me a museum and I'll fill it. (Picasso) Give me a forum ...
- Joined
- Jul 3, 2008
- Messages
- 35,712
Inflation can't be helped, but other subtractions from return can. In fact, one can squander even a 10% market return if he is not watching for these pitfalls.Bogle did. 6% is the gross stock return. If you have 50/50 stock/bond portfolio gross return is 4.5% Then after subtracting 2% for inflation, either 1.5% (active fund costs) or 0.05% (index fund costs), 1.5% for investor behavior, and 0.5% for taxes....
Similar threads
- Replies
- 22
- Views
- 3K
- Replies
- 38
- Views
- 4K