FIRECalc vs REW

REWahoo

Give me a museum and I'll fill it. (Picasso) Give
Joined
Jun 30, 2002
Messages
50,032
Location
Texas: No Country for Old Men
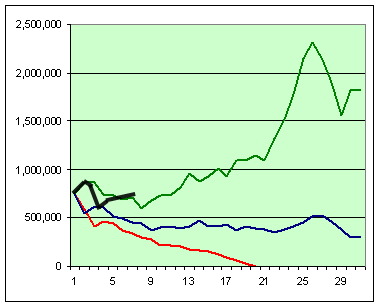
Earlier today I posted the chart Dory36 uses on the first page of FIRECalc to show how market performance in the first few years of retirement can affect portfolio survival. Bottom line: a bad start can be very bad news.

Not sure if this is of interest to anyone else but me, but I was curious to see how my actual numbers (adjusted to chart values) would look now that we've been FIRED for seven years:
img_1273655_0_55a245c78e8547ab5442bc2286639421.gif


The three examples (red, blue and green) adhered strictly to the 4% plus inflation adjustment formula while I definitely have not. With no pension or SS during the first three years of retirement, our withdrawal rate averaged 7.9% of our initial portfolio value. With both DW and I now on SS our withdrawal rate declined to 3.9% of our initial portfolio value in year seven.

Of course the jury is still out, but I am encouraged that my black line seems to be tracking closer to the path of the green than the blue or red - at least so far. :)
 
Last edited:
  • Like
Reactions: W2R
Barring calamity, now collecting social security, you have a much easier path. Many of us hope for similar successes. Cheers! Joe
 
Looks like you did the best possible thing. Congratulations on seeing it work out so well.
 
Congratulations. Bet you are looking forward to the 21st year!
 
Well done REW. I would call that a very reassuring chart.
 
Outstanding! Here's hoping we all get off to such a good start...
 
Wow, excellent! :clap:

To what do you attribute your portfolio's good performance? Bringing in SS in such a timely fashion (in 2009, IIRC?) seemed like a smart move to me at the time.
 
To what do you attribute your portfolio's good performance?
2% investing prowess, 8% not panicking when the market tanked in 2008, and 90% dumb luck. [ Edit: forgot to give 50% credit to psst, Wellesley. :) ]

Bringing in SS in such a timely fashion (in 2009, IIRC?) seemed like a smart move to me at the time.
While there are very good reasons to delay SS to FRA or age 70, taking it at age 62 (2009) was for me, the right move I believe.
 
Last edited:
2% investing prowess, 8% not panicking when the market tanked in 2008, and 90% dumb luck.
Percentages are undoubtedly off, but a good example/lesson showing panicking (a natural response) has historically been a mistake. Staying the course is not an easy thing to do when faced with a harsh correction, but historically the right choice. No need to debate with doomsayers, so YMMV.
 
Way to go REW. Even given a tough challenge, you have prevailed.
No need to debate with doomsayers, so YMMV.
I sure agree; not even worth the breath. Let's ask the mods if they can just ban those pesky doomsayers.

Ha
 
The three examples (red, blue and green) adhered strictly to the 4% plus inflation adjustment formula while I definitely have not. With no pension or SS during the first three years of retirement, our withdrawal rate averaged 7.9% of our initial portfolio value. With both DW and I now on SS our withdrawal rate declined to 3.9% of our initial portfolio value in year seven.

That's darn impressive! And the WR being higher than FIRECalc's 4% says that the last few years were not as bad as the economic condition back in the early 70s, as hard as it is to believe.

No matter though. I am going to kick it up a notch myself. As I could not hold my expenses to the 3.5% I originally planned, I am doing 4% now. And that's 4% of current portfolio value, so that if the market keeps rising, I will be living hog-wild.
 
Thanks for posting, I think real life examples are always good to see, and it's good that you are doing well.

And though that intro story from FIRECALC is important and illustrative, it is also misleading, I think. Here's the problem:

It infers that someone retiring in 1973 (red-fail), 1974 (blue-ok) or 1975 (green-winnah!) with $750,000 is an apples-apples comparison. But since the market declined in each of those years, the 1975 and 1974 retiree had a lot more in 1973 than the 1973 retiree. So I don't see it as apples-apples.

For simplicity, I used S&P500 adj values (from yahoo - includes div/cg re-invest) for 1973-1975. So :

$750K in Jan 1973, means that to still have $750K in 1974, you had:
$918K in 1973. And to still have $750K in 1975, you had:
$1,277K in 1973.

Those numbers would be different with a more balanced portfolio, and maybe accounting for another year or two savings, but I'll leave it to someone else to dig that deep, this should be close enough for a simple comparison to get the idea across.

Using the "provide data and formulas in a spreadsheet format, using ____ as the starting retirement year" option in the investigate tab, we see that the 1973 retiree with a $750K start and $35K spend (note - that is 4.67%, not 4%) goes negative ~ year 19, and is @ -$511K at year 30.


So let's re-run the numbers, to see how a 1973 retiree would have performed if he had the $1,277K that the example 1975 retiree would have had in 1973... (off to another FIRECALC run)...

OK, he doesn't goes negative at all, and he ends year 30 @ plus $1,538K. So a 1973 retiree with the kind of money that the example 1975 retiree had does about as well as that 1975 retiree.

If that wasn't clear, look at it the other way - three guys with $750K in 1973. By 1975, the guy that waited to retire doesn't have $750K anymore, the market took a bunch from him, so he would run FIRECALC with a lower starting portfolio. Heck, let's try that too:

If you had $750K in 1973, you'd only have $440,516 in 1975 (again, assuming 100% S&P500 and no added savings). So we plug that in with a 1975 starting year and $35K spend, and...

he goes negative in year 19, and ends year 30 @ MINUS $523K. Again, not that different from the 1973 retiree.

Does that make sense? Did I miss something?

-ERD50
 
Thanks, ERD50, for reminding me of this. We have visited this topic time and time again, but I guess old age memory loss is creeping up on me.

The same retiree, if he started in 1973 at the top of the market would be spending (1277/750) = 1.7X what he would spend if he retired at the bottom in 1975.

Relating to the recent years, to rehash this problem, what this means is that a retiree who counts on spending 4% of his stash at the top of the market in 2007 will not do as well as a retiree who counts on spending 4% of the value at the bottom of the market in early 2009.

However, this brings us back again to the perennial question of "knowing" where we are in the economic or stock cycle, in order to base our spending.

I think I should try to do 4% of the current portfolio, and reset every year. That may be hard to achieve and really crimps my style in bad years, but I would never run out of money that way.

In my case, my 2012 expenses, and hopefully 2013 too, are at 3.5% of my current portfolio. Relative to the bottom value in 2009 (I was not retired then), my expenses would be 5.7%.

The hapless retiree in the example who started in 1973 would be spending 1.7 X 4% = 6.8% in 1975. Just a few percent more above 4% eventually bankrupts him, but in real life he would have moved down to a little trailer to survive.
 
Last edited:
While there are very good reasons to delay SS to FRA or age 70, taking it at age 62 (2009) was for me, the right move I believe.

This is an important lesson. "Wait 'til 70" is becoming almost a bit dogmatic and a real life example showing a reason to start earlier is very helpful.
 
Thanks, ERD50, for reminding me of this. We have visited this topic time and time again, but I guess old age memory loss is creeping up on me.

....

However, this brings us back again to the perennial question of "knowing" where we are in the economic or stock cycle, in order to base our spending.

I agree with your observations, it is about relative 'value' of those portfolios, but we can look at this very simply. We don't have to "know" where we are in an economic cycle. Essentially, FIRECALC does this for us, (historically), by testing that starting portfolio against every year in the data set, and that tests the 'value' of that portfolio in that year.

This makes more sense and is easier to discuss if we target 100% success. Recall that those front page graphs are based on 4.67% spending, not the 4% spend / 95% success profile. But if we shoot for 100% success, FIRECALC will tell us what we can spend and still survive any historical time period, and that spend amount largely depends on the relative 'value' of the starting portfolio. But we don't have to 'know' it, it just becomes a factor in whether that succeeds or not.

So, a 3.59% WR survives 100% of the past 30 year periods in the FIRECALC data set. And if the worst of our future is no worse than the worst of the past (no guarantee of course), then that same 3.59% will succeed, even if our portfolio value is at a historical low point. It's already taken into account, not by attempting to determine the value of the portfolio, but just be testing it.

So, one would not need to cut their spending below 3.59% based on any assumptions of their portfolio 'value'. But I suppose one could decide to boost their spending, if they felt confident that their portfolio was at a high value.

It's a moot point for me, I plan to stay a bit under 3.5% to allow for some buffer for unknowns.

-ERD50
 
... We don't have to "know" where we are in an economic cycle. Essentially, FIRECALC does this for us, (historically), by testing that starting portfolio against every year in the data set, and that tests the 'value' of that portfolio in that year.

This makes more sense and is easier to discuss if we target 100% success. Recall that those front page graphs are based on 4.67% spending, not the 4% spend / 95% success profile. But if we shoot for 100% success, FIRECALC will tell us what we can spend and still survive any historical time period, and that spend amount largely depends on the relative 'value' of the starting portfolio. But we don't have to 'know' it, it just becomes a factor in whether that succeeds or not...

Surely, one can keep it simple to ensure survivability, in deciding when to pull the plug.

But once in retirement for a few years, and if things work out, one's portfolio might just keep growing like Jack's beanstalk, or at least like FIRECalc's most optimistic line. I doubt if I would still stay with the 4% WR based on the original amount, back when I was a few millions poorer. I would "kick it up a notch" in my lifestyle.

And on the other hand, if the market tanks, I doubt if I would continue to spend like I originally planned. Would I keep on drawing down my precious cash to feed my motorhome and go on travel? I doubt it.

Hence, I think trying to stick with a fixed % of the present portfolio makes the most sense for me.
 
Last edited:
...(snip)...
If that wasn't clear, look at it the other way - three guys with $750K in 1973. By 1975, the guy that waited to retire doesn't have $750K anymore, the market took a bunch from him, so he would run FIRECALC with a lower starting portfolio. Heck, let's try that too:

If you had $750K in 1973, you'd only have $440,516 in 1975 (again, assuming 100% S&P500 and no added savings). So we plug that in with a 1975 starting year and $35K spend, and...

he goes negative in year 19, and ends year 30 @ MINUS $523K. Again, not that different from the 1973 retiree.

Does that make sense? Did I miss something?

-ERD50
You bring up a good point ERD50. I would think that the comparison could be:
1) 1973 retiree with a 60/40 portfolio
2) 1974 retiree with a 60/40 portfolio that is higher by 1 year of spending that he did not do + savings from his salary
3) 1975 retiree, same as 1974 but make that 2 years of not spending + saving

All those retiree's got hit by the same bad markets in 1973-1974.

Congratulations to REWahoo on surviving and propering in ER. :) We did somewhat similarly i.e. spending at a higher rate then taking SS at 64. It was a real relief to get the percentage spending down using that SS -- peace of mind. Our black line would be close to REWahoo's.
 
It infers that someone retiring in 1973 (red-fail), 1974 (blue-ok) or 1975 (green-winnah!) with $750,000 is an apples-apples comparison. But since the market declined in each of those years, the 1975 and 1974 retiree had a lot more in 1973 than the 1973 retiree. So I don't see it as apples-apples.
.....
If that wasn't clear, look at it the other way - three guys with $750K in 1973. By 1975, the guy that waited to retire doesn't have $750K anymore, the market took a bunch from him, so he would run FIRECALC with a lower starting portfolio. Heck, let's try that too:

.....Does that make sense? Did I miss something?

Maybe I'm being too simplistic but I think this is sort of making a huge assumption and then is sort of missing the point of the graphs.

This all seems to assume that the retiree with $750k in 1975 had more in 1973 than the retiree in 1973 who had $750k and your analysis goes from there. I have 2 problems with this.

One - I can think of plenty of situations in which that wasn't the case and can give one my own situation. When DH retired in 2010, he took a lump sum in lieu of a pension. It would be nonsensical for me to be thinking about what he would have had to have had in 2008 to have what he received in 2010. He didn't have it in 2008. He only got it in 2010. There are many other situations where that would be true as well (sale of business, inheritance, winning the lottery, bank robbery, etc.).

Two - I think your analysis sort of misses the point of the graph. The point of the graph is to show how 3 different people retiring in different economic conditions with the same amount of money would end up with vastly different results even if they all invested similarly and withdrew similarly. I think to get hung up on the one with $750k in 1975 would have had to have more in 1973 to end up with $750k in 1975 misses the point entirely. The big picture here is that you can't just determine portfolio survival based upon how much money you have and your asset allocation and withdrawal rate. What is happening in the overall market for your investments also matters.

If it makes it easier, just assume that each one of them came into their money only in the year that each of them retired.
 
I think your analysis sort of misses the point of the graph. The point of the graph is to show how 3 different people retiring in different economic conditions with the same amount of money would end up with vastly different results even if they all invested similarly and withdrew similarly. I think to get hung up on the one with $750k in 1975 would have had to have more in 1973 to end up with $750k in 1975 misses the point entirely. The big picture here is that you can't just determine portfolio survival based upon how much money you have and your asset allocation and withdrawal rate. What is happening in the overall market for your investments also matters.

If it makes it easier, just assume that each one of them came into their money only in the year that each of them retired.

+1

In my best Professor Higgins voice, "By Jove! I think she's got it!" :LOL:
 
I think the point in that graph is that there are a lot of points of view. :)

Probably the intention in the FIRECalc introduction was indeed to show that different starting years produce different outcomes. However, there are other points to make about "when should I retire and how much do I need?". We all need to get our 2 cents in on this. ;)
 
Thanks for posting, I think real life examples are always good to see, and it's good that you are doing well.

And though that intro story from FIRECALC is important and illustrative, it is also misleading, I think. Here's the problem:

It infers that someone retiring in 1973 (red-fail), 1974 (blue-ok) or 1975 (green-winnah!) with $750,000 is an apples-apples comparison. But since the market declined in each of those years, the 1975 and 1974 retiree had a lot more in 1973 than the 1973 retiree. So I don't see it as apples-apples.

......

-ERD50

Good point. I think the relevance depends on the question.

1) Would a person who hit 62 in 1973 help or hurt himself by waiting 2 years to retire? How much?

2) Were people born in 1913, who retired at 62 in 1975, a lot luckier than those who were born in 1911 and retired in 1973?

3) I have $750k and I'd like to retire today. Can I retire with an initial [$60k; $45K; $30k; $15k] withdrawal, adjust it annually for inflation, and expect my money to last longer than I do?

I think FireCalc is designed to answer question 3, and it does a reasonably good job.

I've seen people use results like FireCalc's to make claims about question 2, that I don't think are valid. The problem is the one you've identified, FireCalc does not look at before retirement returns.

Similarly, question 1 requires more than FireCalc for a meaningful answer.
 
Earlier today I posted the chart Dory36 uses on the first page of FIRECalc to show how market performance in the first few years of retirement can affect portfolio survival. Bottom line: a bad start can be very bad news.

Not sure if this is of interest to anyone else but me, but I was curious to see how my actual numbers (adjusted to chart values) would look now that we've been FIRED for seven years:


The three examples (red, blue and green) adhered strictly to the 4% plus inflation adjustment formula while I definitely have not. With no pension or SS during the first three years of retirement, our withdrawal rate averaged 7.9% of our initial portfolio value. With both DW and I now on SS our withdrawal rate declined to 3.9% of our initial portfolio value in year seven.

Of course the jury is still out, but I am encouraged that my black line seems to be tracking closer to the path of the green than the blue or red - at least so far. :)

I've been retired for 6 years, and my personal graph would be much like yours. We're about flat if I use nominal dollars, but we're down if I use real dollars.

Of course, nothing went as planned. Medical expenses were way higher than anticipated, entertainment was way lower, I had a good short term consulting opportunity, we ended up helping relatives we'd never expected to help.

I'd always expected to defer SS, so the plan was that assets would drop in the early years. That part doesn't bother me. The way we spent the money is frustrating.
 
Thats a GREAT graphy REW ! Thank you for sharing a "real world" result.

I'm really afraid of that red line so I only use 90% of my portfolio in Firecalc and other calculators. It makes me feel a little better but I'd rather see a 20% "contingency" when I do this stuff. I do suspect however that if I did get to a point where I could do a 20% contingency that I'd push my "desired level" to 25% ... and then 30% ....

Increasing that contingency is my way of betting against "bad timing". But how much is "enough" ? There's really no reasonable answer to that question ....
 
Back
Top Bottom