How I did during the Great Recession

NW-Bound

Give me a museum and I'll fill it. (Picasso) Give me a forum ...
Joined
Jul 3, 2008
Messages
35,712
The concurrent threads about market timing reminded me of a promise I made a while back to show what I did during the Great Recession. Though I did dig up the data and made a plot, I then forgot about it until now.

What happened was that from market bottom in Oct 2002 to market top in Oct 2007, my portfolio grew a factor of 2.71x despite the purchase of a 2nd home and not contributing that much to my stash due to part-time work, hence having limited income. Part of the gain was due to some investment in economic-sensitive stocks, particularly the ones feeding off the Chinese economy boom such as the mining industry, solar energy, fertilizer, etc...

When the world economy started to crumble, of course the stocks that went up the most also went down the fastest. If I did not get out of them, I would be in deep doodoo. The Chinese were driving the price of copper up to near $4/lb, and in a matter of a month in late 2008, it dropped to near $1/lb. Yikes!

I keep a daily diary of the total of my investable accounts, but the breakdown of the AA is recorded only at the 1st of each month. That record was the basis of the plot that I am showing below.

Looking back, I sold a bit late, but not too late. And then, I bought back right on time. I made "buy, buy, buy" posts back then, which the records still show. My problem was that I then soon started to sell gradually, instead of sitting on it. I would do a lot better if I did not sell out too soon in mid/late 2009. I was worried about a double dip that never came. My AA is normally 75% equities, 5% bonds, and 20% cash. I always like to keep a lot of cash.

I am right now close to 25% cash, 5% bonds, and 70% stocks. This info is for entertainment values only. I am not trying to make any point, other than that a self-proclaimed market timer and stock picker like myself, albeit a chicken one, can survive very well. I say chicken because I never go 100% stock, nor 100% cash.

Flame away! :D

 
Last edited:
Buying at the bottom of a market is, of course, the right thing to do. Actually doing it though, takes, as Options says, some real cojones. Good for you!
 
For selling while the market was going down, and my stocks were going down 2X or 3X? Heh, I was just trying to save my ass---ets.

Or for buying and driving the cash AA from 65% to 40% right at the market bottom? Not really!

Heck, if I were not chicken or if I were smarter, I would have plunked more down.
 
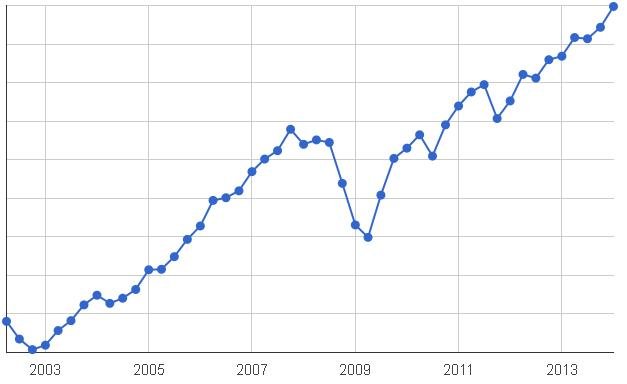
Here is a chart showing the relative performance, sans actual numbers, of my portfolio since 2003, updated quarterly. Records further back were lost when my 401k provider changed. Numbers up until 2008 included money put in by me and the employer match.

I lightened riskier assets in the fall of 2008, then reloaded to my more usual allocation in spring 2009.

From beginning to end, I'm up 166%.
 

Attachments

  • port chart.JPG
    port chart.JPG
    23.6 KB · Views: 50
Without even a normalized scale, people cannot easily tell how much you "lost" during the Great Recession.

You can tell that from Jan 2007 to the bottom, I lost 20%, but counting from the high-water mark in Oct 2007 it would be around 40%.
 
I left my 401k on auto during the Great Recession and tried to ignore it. My balance curve looks the same as the above curves with return to pre-recession value about the same time.
 
It looks like over the 4 years (2007-2010, inclusive) that you generated a return of about 3.6% per year based on a beginning value of 1.00 and an ending value of ~1.15 (assumes no contributions or withdrawals).

For the same period my portfolio return was about 2% according to Quicken.

I remember that my AA was screaming at me to sell bonds and buy stocks but I was like a deer paralyzed in the headlights and stood pat rather than selling bonds and buying stocks. Still, I know numerous people who sold and never got back in and are kicking themselves so I'm happy that I stood pat.
 
It looks like over the 4 years (2007-2010, inclusive) that you generated a return of about 3.6% per year based on a beginning value of 1.00 and an ending value of ~1.15 (assumes no contributions or withdrawals)...

The return from 2003 to 2007 was 2.71x as I said earlier, or an annualized 28% assuming no inflow/outflow. If I did not bail out of these hot stocks, I would give it all back.

My problem with computing an accurate return number was that from 2000 to 2012, my part-time work (W2 and 1099) was so sporadic that my income fluctuated wildly. So, during that time I had to draw on my savings for expenses for some months, and then made up for it when I worked. My compensation was reasonably high to support a low 6-figure expense with part-time work. And I spent more time looking at my total balance than the inflow/outflow, because the increase of the former was all very gratifying during the bull market of 2003-2007.

I would have to go back to reconstruct the cash flow during those years, but it takes way too much work. However, I also know that I spent a lot back then with children college and 2nd home purchase.

My portfolio has been just so-so since 2011. It's partly because I am getting more conservative, plus I have not spent the time to look for hot sectors, like the recent biotech that I missed out. I guess my goal of spending less than 3.5%WR could be met without taking risks, so I stopped.
 
Last edited:
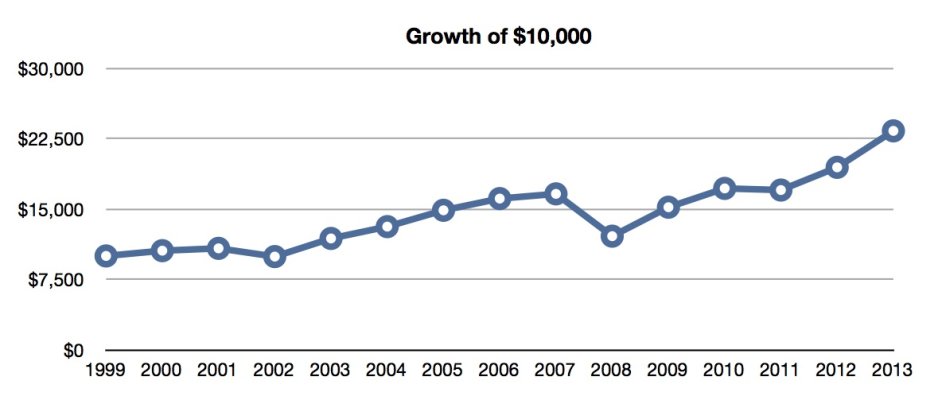
This is from 1999, and normalized for contributions and withdrawals each year. Was still making a few contributions in the 2000s (so they are not included in the growth), and started making some withdrawals 2010 and on (so they are not subtracted from the growth). The withdrawals weren't significant until 2013.

Normalized to starting value of $10,000

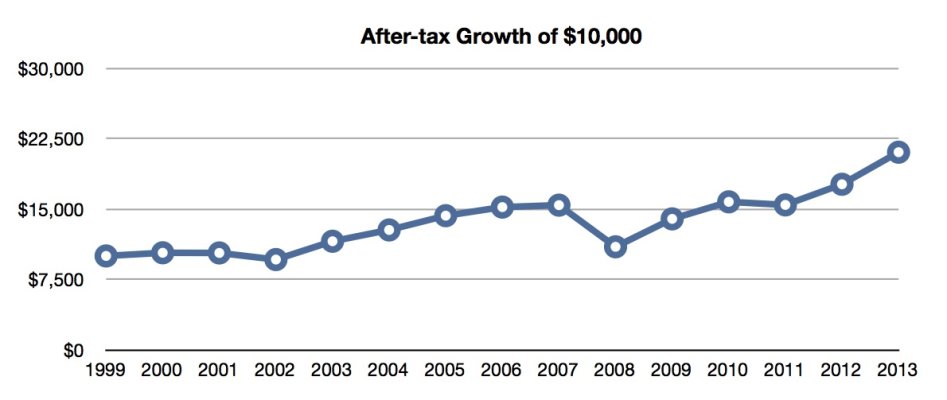
The second graph is the after tax normalized growth.

As you can see, things were a bit slow in the early 2000s, had grown by 50% by 2007, got hit pretty hard in 2008, recovered to 2007 levels by 2010, stalled in 2011, and then took off like a rocket after that.
 

Attachments

  • Retirement Growth of 10K.jpg
    Retirement Growth of 10K.jpg
    79.4 KB · Views: 44
  • After Tax Growth of 10K.jpg
    After Tax Growth of 10K.jpg
    80.6 KB · Views: 38
Last edited:
Nice graphs! Don't we always like to see ones that move up to the right?

I will need to make an equivalent chart of mine. I am sure mine will have larger peaks and troughs. I like to live dangerously.
 
Since some people were saving and others not, or not so much, it would seem to me that an IRR between two specific dates would be a better yard stick than a graph of the balance over time.
 
I cannot get an accurate IRR except for the last 2 years due to lack of inflow/outflow data. But my performance between any 2 points can vary wildly. For example, I am now at 3.3X the value in 10/2002, but only at 1.85X the value in 3/2000.

Why? I lost big money from 3/2000 to 10/2002 due to the tech stock crash. Perhaps I will look good again if the starting point is set back into 1995-1996, but I did not keep records of that.

That's the nature of investing. It's an ongoing process and one can never be sure that past performance will continue.

PS. Note that from 3/2000 to 10/2002, the NASDAQ lost 78% of its value. I lost a "mere" 44%. Look at it another way, the NASDAQ got down to 22 cents on the dollar, while I still had 56 cents.
 
Last edited:
The graphs I posted above are normalized for annual ROI (same as IRR) with the contributions and withdrawals adjusted out each year.

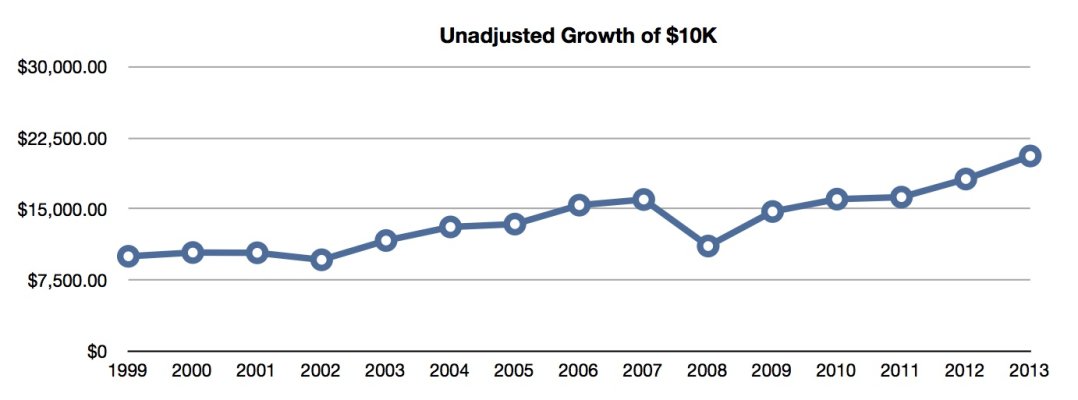
Here is one with just the straight end of year portfolio value. There are a few small bumps and dips unrelated to market conditions, but overall it pretty much looks the same as the others.

BTW - my 2000-2002 graph would look much worse except I happened to be averaging a lump sum into the market over those years. So I didn't take nearly as big a hit in 2000 and 2001 as I could have. 2002 still got me ;).
 

Attachments

  • Unadjusted growth of 10K.jpg
    Unadjusted growth of 10K.jpg
    84.6 KB · Views: 35
Last edited:
The recession ended up being very good for us as we stayed employed (except for about 9 months where I was on leave of absence / between jobs) and we shoveled money into investments.

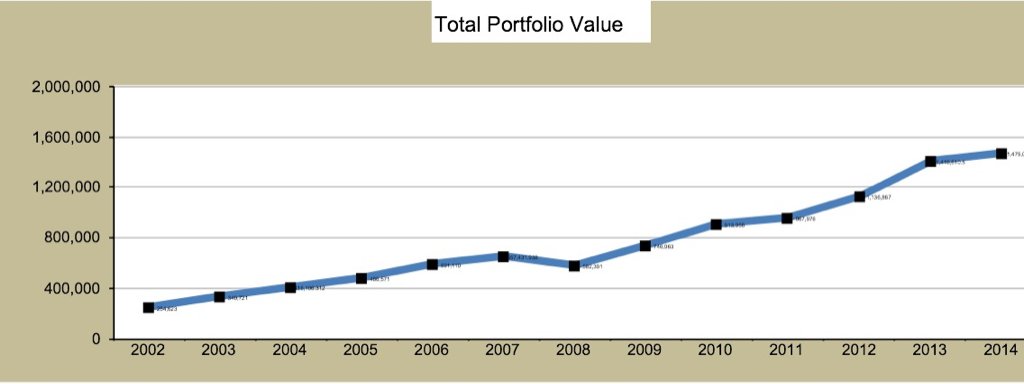
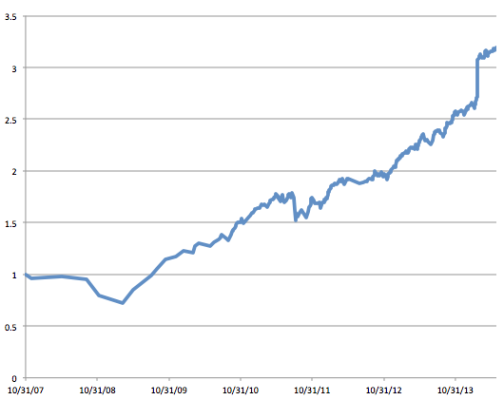
I don't have good inflow/outflow data (it would be too much of a pain to recreate), so here is our normalized portfolio graph (starting value of 1 in Oct. 2007).

At the bottom of the recession we were down about 30%.
 

Attachments

  • portfolio-normalized.png
    portfolio-normalized.png
    43.3 KB · Views: 28
A market crash is a godsend for people who are accumulating, IF they have the guts to buy.

Retirees are like people who are out of ammo in a duck hunt and can only watch.
 
A market crash is a godsend for people who are accumulating, IF they have the guts to buy.

Although logically I know this is true, at the time it was very discouraging to be going backwards despite putting new money into accounts. It felt like months of work were being wasted and there is always the possibility of losing your job (I had a hefty mortgage payment of ~3k/month to worry about).

It turns out that my whole group was laid off, but this ended up being a good thing financially because I received generous severance (I think with vacation it was ~20 weeks), had a new job lined up before I even left my old position, and got substantial raise + signing bonus.
 
The market crash in 2008 was great for me because it gave me an enormous buying opportunity when I left my company in late 2008 to buy shares in my chosen bond fund at bargain basement prices using money from my former company's stock sale proceeds while its value was still nice and high.

My ER plan received a huge boost at the time, enabling me to buy about 25% more shares than I had anticipated because of the market crash.

The 401k I had at the time took a beating but when I ERed and had to liquidate the account, I used the same AA I had at the time for the rollover IRA, an IRA whose value has bouneced back very nicely and then some in the last 5 1/2 years. Without having added a single dollar of outside money and having done only some careful rebalancing to a fairly moderate AA (55/45, 50/50), the IRA's value has nearly doubled in that time.
 
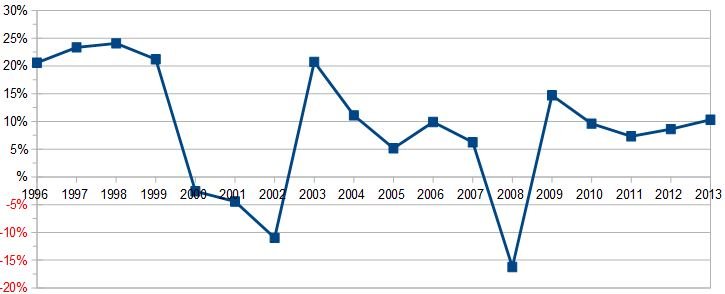
This has been my IRR since 1996 which is when I first seriously started tracking these things.

The sequence of returns since ER at the start of 2010 has been very settling.
 

Attachments

  • Capture.JPG
    Capture.JPG
    39.2 KB · Views: 31
Since some people were saving and others not, or not so much, it would seem to me that an IRR between two specific dates would be a better yard stick than a graph of the balance over time.

Agreed, though that data is not readily available, and I'm too lazy to figure it out from spotty records... :LOL:
 
A market crash is a godsend for people who are accumulating, IF they have the guts to buy.


Yep. The years following the crash were my biggest accumulation years in my 401k- maxing out contributions with catchup contributions at highly reduced share prices. I never changed my AA. I've had a 133% gain in the 401k balance since the bottom.
 
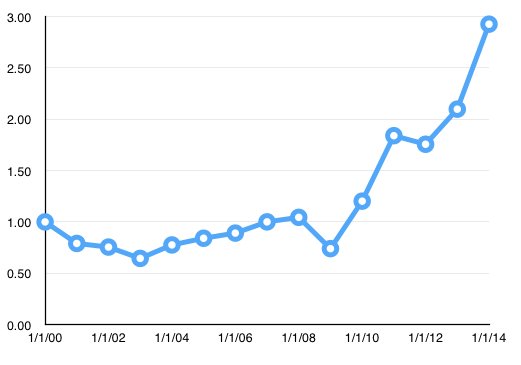
Based on my annual IRR data, here is a graph of my normalized cumulative returns since 1/1/2000. After the 2008 scare, we ramped up the risk considerably by concentrating our portfolio, which accounts for the excess returns in the later years.
 

Attachments

  • Portfolio_Performance.jpg
    Portfolio_Performance.jpg
    54.5 KB · Views: 19
After the 2008 scare, we ramped up the risk considerably by concentrating our portfolio, which accounts for the excess returns in the later years.
Your high returns in the recent years look like what I got myself in the years 2003-2007. You were concentrated in biotech, I assume, while I was betting on material stocks back then.

Curious people can just look back at price charts of SUNE (formerly WFR, the premier silicon wafer company for solar panels), POT (potash production), FCX (copper mining), even X (US Steel), etc... All were driven by the Chinese economic expansion, or the housing bubble. I was chicken and was not 100% in these stocks and always held 20-30% of cash, else would get more than the 3.3X factor in 4 years.

I have read earlier that active stock pickers have to work to stay on top of things to maintain the performance, and the moment you get complacent you get creamed. I am more conservative now. Look how hard these stocks crashed in late 2008. These are real companies with decent P/E, and no dotcoms.


PS. Even though I was sector-concentrated, I spread my bets out among 50 to 100 stocks. This sector play is easier now with sector ETFs. Of course, one can try to pick the hottest one in each sector, but I did not count on being so lucky (cojones not that big ;) ).


PPS. I did not really trade that much, and tended to ride the stocks until something big broke fundamentally. It was in late 2008 that the demand for raw material suddenly dried up, as if the world stopped spinning.
 
Last edited:
A market crash is a godsend for people who are accumulating, IF they have the guts to buy.

Retirees are like people who are out of ammo in a duck hunt and can only watch.
Well, at least we get to rebalance.
 
Back
Top Bottom