Ready
Thinks s/he gets paid by the post
I found an interesting article on personalcapital.com on withdrawal rates. I am not sure how to post a link to it because it appears you have to be logged in to an account on the site to see the article. I won't post the entire article here to avoid copyright issues, but hopefully someone else can figure out how to paste the table in the article. They suggest that a 50/50 portfolio has a 50% failure rate over 40 years. What I can't figure out is that if they based their assumptions on 8% returns on stocks, 4.5% for bonds, and 3% inflation, what type of simulation are they using such that their sequence of returns exceeds the losses of the great depression, which Firecalc includes in it's analysis and still says I can have a 100% success rate over 40 years at 3.23% WR.
If you haven't used personalcapital.com's web site, it's similar to Mint.com. It aggregates your financial info and gives you a nice snapshot. I find it nicer to use than Mint and actually pretty useful in for doing analysis.
From the article...
https://home.personalcapital.com/pa...hts/how-much-can-you-spend-for-retired-people
Odds of Portfolio Survival
First, let’s look at some generic odds of investment portfolio survival with some basic assumptions.
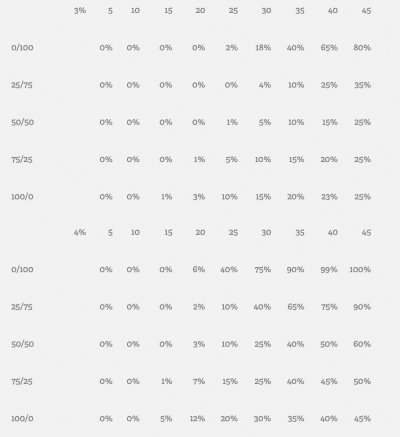
Assumptions used are an 8% annualized return for stocks (20% annual standard deviation), 4.5% for bonds, and 3% inflation. Withdrawals stay constant, but are adjusted for inflation. No fees or transaction costs were included and the assumption was that all money is taxable, and that the tax rate on gains is 15%. In real life, expect higher fees and taxes. Remember taxes may still be due on deferred accounts such as IRAs, so you may have less money than you think.
These assumptions may prove wrong, but they are a good starting point for analysis.
This table shows the chances of a portfolio running out of money at some point before the given time horizon expires. It is segmented by each annual withdrawal rate, starting at 2%, and shows results for several different stock/bond allocation mixes.
Odds of Portfolio Exhaustion Table:
Can someone else show me how to paste the table here? I haven't figured out how to paste graphics into these threads.
If you haven't used personalcapital.com's web site, it's similar to Mint.com. It aggregates your financial info and gives you a nice snapshot. I find it nicer to use than Mint and actually pretty useful in for doing analysis.
From the article...
https://home.personalcapital.com/pa...hts/how-much-can-you-spend-for-retired-people
Odds of Portfolio Survival
First, let’s look at some generic odds of investment portfolio survival with some basic assumptions.
Assumptions used are an 8% annualized return for stocks (20% annual standard deviation), 4.5% for bonds, and 3% inflation. Withdrawals stay constant, but are adjusted for inflation. No fees or transaction costs were included and the assumption was that all money is taxable, and that the tax rate on gains is 15%. In real life, expect higher fees and taxes. Remember taxes may still be due on deferred accounts such as IRAs, so you may have less money than you think.
These assumptions may prove wrong, but they are a good starting point for analysis.
This table shows the chances of a portfolio running out of money at some point before the given time horizon expires. It is segmented by each annual withdrawal rate, starting at 2%, and shows results for several different stock/bond allocation mixes.
Odds of Portfolio Exhaustion Table:
Can someone else show me how to paste the table here? I haven't figured out how to paste graphics into these threads.