it's the crash of October 2014 all over again

i don't buy into the old saying it is only a paper loss for one second and that it does not count unless you sell. selling only creates a taxable event if in a taxable account but your net worth at any given moment is your balance.
I think you misunderstood me.

I believe that a gain is not "real" until you realize it, meaning selling it. Yet, one cannot deny that he has a loss when his investment goes down. How many people hang on to a losing stock until it goes bankrupt, becomes worthless, and stops trading?

ask yourself this, lets suppose at the end of the day you sold after a down day and bought another investment the next opening morning . lets suppose you rode that new investment back up ,is that any different than keeping the money in play in the same investment over night if they went up the same?

of course it isn't . in either case the money stays in play in the risk pool and is just as much your balance at any time.

it has nothing to do with selling or not , it just has to do with keeping the money in play so you can possibly recover from a drop.

it can be the same investment or a shift to a different one but results are the same and it has nothing to do with selling or not..

No, the results are not necessarily the same. Earlier, I told the story of my capitulation, selling my tech stocks and realizing a loss of $600K in 2002 after the tech rout. Had I hanged on to these stocks that languished for years or went bankrupt like Nortel, Global Crossing, WorldCom, I would not be where I am today.

Speaking of Nortel, recently I met another engineer who worked at Nortel. He said that he traded his 401k in/out of Nortel stock in the 90s and early 2000s. When it went up, he sold. When it went down, he bought. But at the last Nortel downturn, after he bought it never went back up. He finally sold his position for $10K. At the highest point, his 401k was worth more than $600K. But the $10K is more than what he would have if he hung on until Nortel went bankrupt.
 
Last edited:
my daily net worth is what it is regardless of whether i am selling , keeping the investments or swapping them out.

like working on commission, each day may be different but as sure as the value of my my bank account those investments are what they are worth at any point in time. i couldn't imagine looking at them any other way.
 
Yes, that's the way I look at my accounts too. However, I also accept that next day or next month the market may decide that I should be a lot poorer. Stock value, and that of most things for that matter, is fleeting or, as Alan Greenspan put it, ethereal.
 
the market gods give and they take away.. we just hope they give more than they take.

but like we said above the fear now is that even small declines on a dollar basis can be huge when portfolios have grown and after all it is the change in dollars that we are interested in not the percentage down so much.

losing 7 years worth of 401k contributions in a minor correction may be a 7% drop percentage wise but it is years worth in living expenses.

we tend to use different yardsticks in retirement.
 
Last edited:
. i couldn't imagine looking at them any other way.

If I were similarly afflicted, I would make every effort to just check my balance annually.
Daily fluctuations are just noise, and no reason for glee or sadness.
Viewing wealth as "shares owned" or "claims against future revenue" can be just as valid as a dollar amount.
 
A bear market is an extended period of time during which people who think this time is different sell all their investments to people who understand that this time is never different.
 
When it comes down to it, I only care about the value of my portfolio on Dec 31 of each year.
 
My long view is that until population growth is curbed, markets will go up.


Sent from my iPhone using Early Retirement Forum
 
Well lookee here, we're above 2075! Might even get a record close. Now that is exciting!

LOL! I just saw that and hurried over here to let you know it punched right thru. Hopefully it will stick and we're on our way to 2100!
 
If I were similarly afflicted, I would make every effort to just check my balance annually.
Daily fluctuations are just noise, and no reason for glee or sadness.
Viewing wealth as "shares owned" or "claims against future revenue" can be just as valid as a dollar amount.

When the "noise" can add up to one yearly expense or, heaven forbid, a decade of expenses, I want to know what's going on. However, I agree that people who have a weak stomach should not look at their account often. I have plenty of relatives who would do a heck of a lot better if they didn't.

A bear market is an extended period of time during which people who think this time is different sell all their investments to people who understand that this time is never different.

Eh, I can say the same thing about a bubble. In fact, I can say the same thing about any market.

There are always a buyer and a seller in any market. What concerns me is what they think the fair price is. And I want to know what the settled price is, even if I am not part of that transaction. It's just my nosy manner. And if the price is irresistible, I may want to enter into that transaction. ;) I hate to miss out on a good deal, whether buying or selling.
 
Last edited:
I'm calling this latest downturn and rebound nothing more than a corrected correction. Very similar to what happened a few months ago.
 
I'm calling this latest downturn and rebound nothing more than a corrected correction. Very similar to what happened a few months ago.

So when it goes down again its an incorrectly corrected correction correct? :cool:
 
I agree the portfolio value is what it is at any given time. However this value is only meaningful at the time I want to sell. For example if my home goes up to $1 million it means the same to me as if it was only worth $100,000. Shelter, warmth, etc.
If you are generating an $80,000 income on a $2 million portfolio a 20% correction or $400,000 should only feel like a $16,000 per year hit on your income. The short-term volatility is felt when you sell but the longer term probabilities remain unchanged.
 
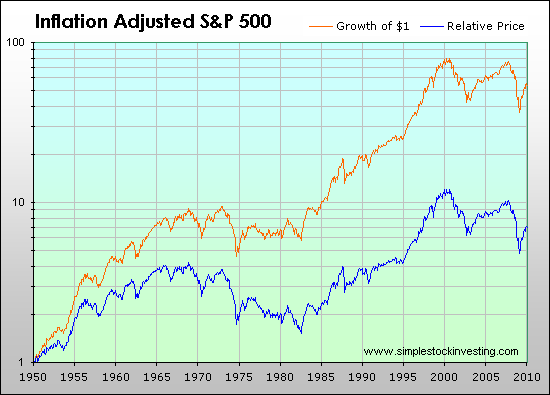
Every so often, to tamper our enthusiasm about equities, we should look at a graph like the one below that I linked in from simplestockinvesting-dot-com. Except for during the secular bull market of 1983-2000, buy-and-holders do not do that well.

For the most recent period of 2000-2013, only people who bought the dips got ahead. These buyers are either younger accumulators with fresh cash, or retirees who rebalance or hold balanced funds that rebalance for them. Buy-and-holders got nowhere.

And look how much investors lost in the period of 1967-1985, even with dividends all reinvested and a WR of 0.

 
Last edited:
True enough. But everyone is an expert in his own mind, thus we will believe whatever we want or need to believe.


Ha
 
Every so often, to tamper our enthusiasm about equities, we should look at a graph like the one below that I linked in from simplestockinvesting-dot-com. Except for during the secular bull market of 1983-2000, buy-and-holders do not do that well.

For the most recent period of 2000-2013, only people who bought the dips got ahead. These buyers are either younger accumulators with fresh cash, or retirees who rebalance or hold balanced funds that rebalance for them. Buy-and-holders got nowhere.

And look how much investors lost in the period of 1967-1985, even with dividends all reinvested and a WR of 0.


Sp500 is a price index, and your graph looks like it may not be total return. Can you confirm it is total return?


Sent from my iPhone using Early Retirement Forum
 
The blue line is price only. The orange line is with all dividends reinvested.

Both are corrected for inflation, as labeled in the chart header.

I quoted the source of this chart in the previous post. One can find many charts like this on the Web. I assume they are all based on the same historical data set.
 
True enough. But everyone is an expert in his own mind, thus we will believe whatever we want or need to believe.

I like to have more people believing in stocks. Not that equity is bad as I am still 70% in it.

But as the price goes higher and higher, eventually something good becomes overvalued. I want to be able to bail out before my cohorts.

Yes, I may be a player in the "greater fool" game too, but I do not think that I have a choice. So, the only thing for me to do is to execute properly, when that time comes. Easier said than done, but a guy has got to at least think ahead.
 
Annualized return of the broader US market ( Wilshire 5000) from 19 Dec 2000 to today (the supposedly flat period when B&H investors made nothing). After inflation and dividends= 3.75% PA. Lessons: Hold a diversified portfolio. Buy and hold can work just fine (I'm virtually certain a Wilshire 5000 B&H investor did much better over this period than the average trader trying to buy on the dips).
 
Last edited:
I was careful to say 2000-2013 instead of 2000 to present, the reason being all the gain from 2000 till present came in the last 2 years.

I do not think the Wilshire 5000 would differ that much from the S&P, but went to Morningstar to look up the performance of the WFIVX Vanguard Wilshire 5000 mutual fund to see for myself. For inflation data, I use data from inflationdata-dot-com.

From 1/1/2000 to 12/18/2014, a $10K deposit grows to $18,014 (dividend reinvested), which is an annualized return of 4.3%. However, that is before inflation, which runs 40% cumulative in that period. The $18K becomes $12.87K after inflation, which is an annualized return of 1.8%/yr.

What is worse is that all that return comes in less than the last 2 years. Up to as late as May 2013, the $10K only grew to $13.8K nominally, which barely matched the cumulative inflation up to that point. In other words, buy-and-hold investors had to wait more than 12 years to break even.
 
Last edited:
OK, Aud, we just crossed 2070. What should we do next.

Get ready to make the magic noise :D. But maybe wait until after Jan 2nd for those of us rebalancing on the first trading day of the year?

I thought today we might have a new closing all-time-high. Intraday high is 2079 something, closing high 2075.4 or thereabouts.
 
I was careful to say 2000-2013 instead of 2000 to present, the reason being all the gain from 2000 till present came in the last 2 years.

I do not think the Wilshire 5000 would differ that much from the S&P, but went to Morningstar to look up the performance of the WFIVX Vanguard Wilshire 5000 mutual fund to see for myself. For inflation data, I use data from inflationdata-dot-com.

From 1/1/2000 to 12/18/2014, a $10K deposit grows to $18,014 (dividend reinvested), which is an annualized return of 4.3%. However, that is before inflation, which runs 40% cumulative in that period. The $18K becomes $12.87K after inflation, which is an annualized return of 1.8%/yr.

What is worse is that all that return comes in less than the last 2 years. Up to as late as May 2013, the $10K only grew to $13.8K nominally, which barely matched the cumulative inflation up to that point. In other words, buy-and-hold investors had to wait more than 12 years to break even.


this will be updated for december at months end.

through november real return from 2000 peak was 1.74% dividends reinvested. we picked up a few more fractions of a % in december.

i-KRtm5nn-X3.gif
 
Last edited:
Back
Top Bottom