Generally speaking, I find most B&H (w or w/o rebalancing) vs. "market timing" debates on the net confusing, because most will usually defend the B&H side yet, in practice, they market time.
The average person who claims to be a B/H usually has a siginficantly different asset allocation than he/she did just 3 years ago. And I'm not talking about any sort of mild "age adjustment" like 1%/year for age. In short, many will talk-the-talk, but few walk-the-walk.
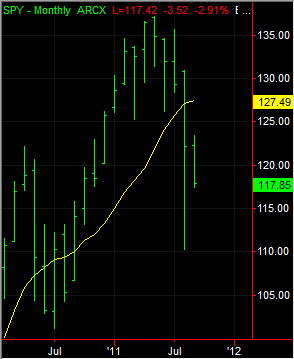
What's happening right now with the markets will provide a great example of my point. Within the next 2-3 months, probably a very significant percentage of claimed "B&H'ers" will reallocate their asset allocation with a more than 10% change in stock/bond/cash equivalents one way or the other. And that would be market timing.
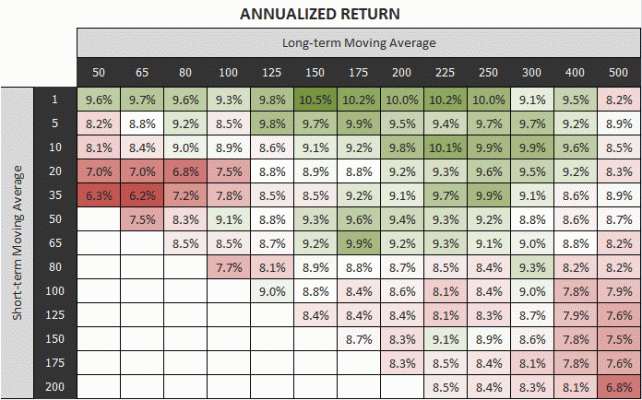
So Gary, they seem to be mostly against you if you go by the words, but if you go by the actions, don't feel so bad. You're most certainly in the majority, I promise you. Now to be clear, I don't mean that they use your particular moving average scheme, or whatever that is your selling, but I'm just referring to the common practice of making statistically significant adjustments to one's asset allocation at least once per 5 years, for example.
Don't get me wrong, though. I actually endorse long-term timing that takes into consideration the world climate and market valuation tools, and making mild-to-moderate asset allocation adjustments based on those. So does well respected asset allocators such as Bernstein (source: The Investor's Manifesto). So I'm not pointing fingers. Rather, I'm just being in the minority that admits I make portfolio adjustments from time-to-time and am aware that disqualifies me from being a true B&H.

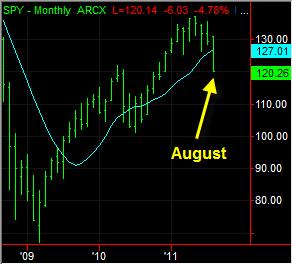
 What would have happened if one tried to side-step those? They'd probably miss a run up.