Modifying the 4% SWR

amt

Recycles dryer sheets
Joined
Jul 20, 2003
Messages
71
http://early-retirement.org/forums/index.php?topic=5572.0

http://early-retirement.org/forums/index.php?topic=667.msg7944#msg7944


Inspired by the above threads where there was an in-depth discussion of the implications of the TIMING of one's ER on the SWR, I'd like to suggest the following:

Adjust/modify the SWR based on the past market return of, say, last 5 years.  If you retired in 1933, your SWR could have been 8% or 10%.  If you retired in 1929 or 1965, or 1999, then it would still be 4% (or lower if you think the future would be worse).  Can we quantify how much additional percentage point one can boost to the 4% depending on the market performance of last 5 years?   :)
 
Just the other day I was trying to figure out what a 4% from Jan 2000 would be today.  I get a little over 6%; here's what I calculated using 75/25 S&P/short bonds:

Market Div IR CPI Assets Withdrawal WR
2000 1425.59 1.16% 6.659% 168.8 100.00 4.00 4.0%
2001 1335.63 1.21% 5.284% 175.1 93.80 4.15 4.4%
2002 1140.21 1.38% 2.435% 177.1 81.45 4.20 5.2%
2003 895.84 1.80% 1.447% 181.7 65.50 4.31 6.6%
2004 1132.52 1.55% 1.461% 185.2 75.30 4.39 5.8%
2005 1181.41 1.64% 3.271% 190.7 74.50 4.52 6.1%

Has anyone else done this calculation as well?
 
On a related topic, there was a link (from poster Charlie) to Gummy-stuff's website yesterday that discussed a withdrawel plan where you took a 3% SWR that was augmented with some percentage of your portfolio gain over the inflation rate (ie. 50%). Basically you only take extra money out when the portfolio exceeds that for a 3% SWR plus inflation. The survival rates were the same as using a 4% SWR.

http://www.gummy-stuff.org/sensible_withdrawals.htm

This approach gives you (on average) a better income stream early in your ER and then it declines with time but never below the 3 % rate. Most ER's could use more cash early rather than later.

Did any of you see this ? What is your reaction ? It looks intriguing to me.

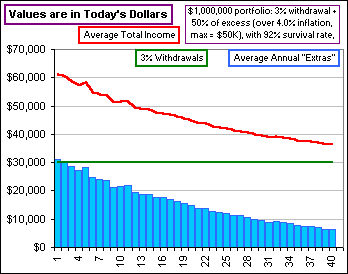
A Traditional 4% SWR on a million dollar portfolio would give you a constant $40k income adjusted for inflation. The Gummy-stuff approach gives you an initial ezxpected income of $62k (inflation adjusted) or so declining to ~$37k (inflation adjusted) as you approach year 40 of ER with the longevity performance the same as the (safe) 4% withdrawal rate.

So if you retired at 50 with a million dollar portfolio, Your income would be higher than the 4% SWR (constant $40k) until you were around 80 years old. Even then your penalty for taking money early would only be at most $3k per year.

The red line on the graph is the withdrawals in inflation adjusted dollars on a Million dollar portfolio predicted using the Gummy-stuff method.
 

Attachments

  • withdraw-1.gif
    withdraw-1.gif
    5.4 KB · Views: 289
  • withdraw-1.gif_thumb
    15.7 KB · Views: 1
gummy is Peter(Pietro) Ponzo, Retired Professor of Math, University of Waterloo.

His graphs confuse me, but I am Mathematically Challenged.

gummy loves Texans, his daughter married one and lives there.
 
MasterBlaster said:
Most ER's could use more cash early rather than later.
You're not providing any data to back that up, but the only study I'm aware of did not evaluate healthcare costs.

I'd suspect that most ERs in their 80s wish they had a little extra cash to avoid having to choose between prescriptions or food.
 
MasterBlaster said:
A Traditional 4% SWR on a million dollar portfolio would give you a constant $40k income adjusted for inflation. The Gummy-stuff approach gives you an initial ezxpected income of $62k (inflation adjusted) or so declining to ~$37k (inflation adjusted) as you approach year 40 of ER with the longevity performance the same as the (safe) 4% withdrawal rate.

This approach should come with a gigantic, flashing, warning sign. . . Lower Standard of Living Ahead

Some could see the high early payout as attractive but then run aground by their inability to constantly reduce their spending habits. What many may end up with is a 6% withdrawal strategy and a significantly increased probability of failure.
 
I think there is too often a focus on the stock component of a SWR. Low yields early in retirement (read today) will have an impact on the longevity of a portfolio..Too often Monte Carlo simulation will not bring make noticeable that we are in a low return environment for bonds. If you just retired, you are likely to get only 4-6& on your bond returns for a while, which is below historical averages.
 
Well healthcare costs/declining standards of living/and investment return outcomes are all good questions.

The intriguing thing about the Gummy-stuff method is that you probably won't have the problem of dying with a multi-million dollar portfolio and lot's of regrets.


healthcare - I'm not worried we have Medicare and National healthcare is right around the corner  ;)

Declining standards of living - Well that model looks good to me. Live better than I would till I'mm 80 and then only pay less than a 8 percent penalty. The concept of don't spend it cause you'll just have to cut back to where you should (4%SWR) be doesn't cut it with me. The economical goal is to maximize the area under the payout curve. 4% SWR is inferior at payout curve area maximization. Many 4% SWR portfolios end up with major unspent millions. Do the unspent millions cause you any concern at lost opportunity - You only live once !

investment return outcomes - well bonds look weak as you point out. It is not clear from Gummy-stuff's graph but he may have used a 100 percent stock slice-and-dice portfolio. I'm not certain. Nonetheless low interest rates just may help propel stock valuations higher.
 
Actually, on the sensible withdrawal spreadsheet, you are able to pick up to 4 of your own asset classes from a list of several. The base withdrawal % and the % of extra in bonus years can be adjsuted as well. If you think you'll be OK with whatever your base is, I don't see anything wrong with having more income in the early years or a somewhat variable annual amount.
 
MasterBlaster said:
The concept of don't spend it cause you'll just have to cut back to where you should (4%SWR) be doesn't cut it with me. The economical goal is to maximize the area under the payout curve. 4% SWR is inferior at payout curve area maximization. Many 4% SWR portfolios end up with major unspent millions.
I think the trick is making sure that 16 (or more) years of sustained low returns or big healthcare expenses aren't the surprises that wipe out an 80-year-old's portfolio.  FIRECalc is great at recycling history but there are way too many overlapping periods to make it statistically rigorous, and it doesn't account for the reversion of returns to some hypothetical mean.

Imagine if you could tweak FIRECalc for inflation (Hey, Dory-- hint, hint!).  Changing its CPI/PPI numbers to reflect the last 30 years' 5% geometric mean would bring failure to an awful lot of currently rosy scenarios.

MasterBlaster said:
Nonetheless low interest rates just may help propel stock valuations higher.
Emotionally, perhaps. 

However from data analyzed by Raddr, "there is almost no correlation between the current inflation rate and subsequent annualized three-year real returns".  I'm not saying that his data is any better than Dory's (or anyone else's) but I have a hard time spending future returns in the absence of a guarantee that they'll be present for me when I turn 80.

His site has some good analysis about the Gordon Equation & future returns, too.  I'm not ***** but 4% may represent the bleeding-edge SWR to a 60-year retirement.  And if you're planning for joint survivability (at least one of a married couple living into their 90s) then it may be even tougher.
 
MasterBlaster said:
Do the unspent millions cause you any concern at lost opportunity - You only live once !

Not in the least.  I would much rather die with $100 MM in the bank then live the last 10 years of my life in poverty.

Besides, you can always choose to increase your withdrawals if you find your portfolio is getting too large.  On the other hand, it is much harder, and in some cases impossible, to recover from a bad withdrawal strategy once you've depleted your assets.

Further besides, you need not wait until some "magical" retirement date to live your life.  It's possible to do both while at the same time avoiding ill-conceived withdrawal strategies that sacrifice your financial security at worst, or commit you to a declining standard of living, at best.

Good luck.
 
I would like to suggest that Gummy's withdraw system be reconsidered by all of you nay sayers.  To make my point I first quote from his website a portion of his dialog:

"I'd like to consider a different scenario where we decide upon some Minimum annual withdrawal rate ... just enough to pay the bills (and live on bread and water) ...then only withdraw beyond that if the market is good to us."

">Which means?"
"I'm suggesting that after we've withdrawn, say 3% for example (to pay the bills), we check to see if our portfolio has increased since a year ago (even after withdrawing that 3%) and, if it has increased by at least the inflation rate, we withdraw some more ... "

">How much more do we withdraw, after a good year?"
"Oh, I don't know. Maybe 25% of the extra monies. "

">Extra monies?"
"Yes, we withdraw our 3%, then see how much is left in our portfolio. If the resultant portfolio has increased (compared to a year ago) by at least the inflation rate - that's the extras - then we withdraw an additional fraction of these extras."


With a careful reading and analysis of this quote you can see that more than a 3% inflation adjusted withdraw is only taken when the portfolio has increased in value more than the inflation rate in the previous year.  This withdraw results in the portfolio increasing it's inflation adjusted value (unless 100% of the extras are withdrawn which would just maintain the portfolio's inflation adjusted value).  So now what happens after a down year?  Only a 3% inflation adjusted withdraw is taken.  However an interesting thing has happened.  After the withdraw this is just like being in the second year of a retirement that started with a portfolio who’s value is >= a portfolio with an inflation adjusted value of the portfolio you actually started your retirement (with fewer years left requiring income).  I now quote a dory36 post that states that you could safely take a 4% withdraw at this point.


"Bonuses or raises? Now, there is another factor that doesn't get discussed all that much in calculations, although it probably gets implemented all the time when we use common sense in deciding how much to spend during our retirement. Let me try to give a logical description.

"We are saying that 4% of the starting balance is safe, meaning that starting from any arbitrary point in time, we can initiate a series of ~30 annual withdrawals of 4% of the portfolio balance at that point in time, with adjustments for inflation.

"We usually talk about this in the situation when the portfolio goes way down -- and the whole purpose of the safe rate discussions is to give us some comfort that if we stop our paychecks early, we can reasonably count on at least 4% of the balance at that point for the next ~30 years.

"But look at the positive side. Let's say that in 5 years, the portfolio is at 1.2 million, after starting at 1 million. (Assume these are all inflation-adjusted dollars for this discussion.) 

"What has happened?

"One thing that has happened is that we have "lucked out", as the scenario that is worst for the survival of a portfolio is a large and lengthy market decline starting immediately after we decide to begin the withdrawals. Except for that scenario, the rate would be a good bit higher.

"Another thing that has happened is passage of time. So now, instead of needing a $1 million portfolio to last for 30 years, we need it to last for only 25 years.

"We can take advantage of our good fortune (timing retirement when we don't have an immediate bear market afterwards) and our new circumstances (more money and a shorter time to spend it) in a couple of different ways.

"One -- we can start over. Just designate this new moment as the start of the withdrawal program, and take 4% of 1.2 million, or $48,000 instead of $40,000, for the next 30 years (or you could take ~4.2%, since you are now looking at 25 years instead of 30...), or,

"Two -- we can take a $200,000 "bonus" to get the portfolio back down to $1 million, and continue drawing 40,000 for 30 years (or 42,000 for 25 years).

"(This seems counterintuitive, but all that is happening is that we are reducing the amount that would have been left over at the end of the 30 year period, since we didn't get the bear market in the first 5 years.)

"So... 4% sets your minimum withdrawal even in bad times, but you can adjust upwards following good years.

"Hope this helps -- dory36 "


The point I would like taken from dory36’s post is that you can start over at any point in time with a given portfolio and a withdraw rate.  Since you have only taken a 3% inflation adjusted withdraw from your inflation adjusted portfolio it is even more likely to persevere than if you were taking a 4% withdraw.  Now depending on how sever the drop in portfolio value you may consider it prudent to not take any (or take less) of the extras after your portfolio starts to regain in value.  However since (unless you were taking 100% of the extras) your portfolio was larger in real terms the year before the downturn than it was originally you could remodel your withdraw rate to the 4% level starting in the predown-turn year and had the several preceding  years of extras withdrawn risk free.  More modeling at this future point in time would provide valuable information in making your decision.
 
Nords said:
Imagine if you could tweak FIRECalc for inflation (Hey, Dory-- hint, hint!).  Changing its CPI/PPI numbers to reflect the last 30 years' 5% geometric mean would bring failure to an awful lot of currently rosy scenarios.

I think you can...just add the desired % to FIREcalc's annual portfolio expense to model higher inflation scenarios.

Cb
 
I read an interesting reply on an ER board a few weeks ago regarding the use of portfolio resetting after a good run in the market - the poster noted that if you study the failure modes of busted retirements they are frequently the result of a particularly bad series of returns early in the 30-40 year period. By frequently "resetting" one's withdrawal after a good run, you are systematically hunting for that series of lousy early returns that might bust your retirement.

Cb
 
CB - Since any withdraw increase over the (100% safe per FIRECalc) level of 3% (inflation protected) is based on "extras", the portfolio is actually at less risk.  This method basically takes a larger withdraw (3% + X% of extras) when times are good (i.e. when the portfolio is keeping up with or ahead of inflation) and a smaller withdraw (3%) when times are bad (i.e. when the portfolio is not keeping up with inflation).  Now to ensure less risk may require the retiree to perform a slightly more complicated calculation to get the yearly withdraw, using this calculation will also ensure that less of the portfolio will be left unutilized by the retiree prior to death.
 
I view the whole SWR thing as a sometimes amusing and sometimes semi serious swag at - handgrenade wise -keeping one's retirement in the ballpark.

Old school - portfolio current yield is 'real money' and taking a few bucks out in a good year out of the 'hobby stocks' is about it. At 85% in trad IRA and 12 yrs into ER - have RMD courtesy the IRS looming in 8 yrs. Also damping SD as 70 1/2 approaches.

Hence - I run a lot of 'what if's' on FireCalc and ORP - but don't directly use them - more for a 'sense' of what happened in various points/periods of history that might be relavant to 'my' ER.

Math is a wonderful thing. So is real life. With a big enough handgrenade and a willingness to adjust - :confused::confused:?

Bon Temps Rolliere!
 
unclemick2 said:
I view the whole SWR thing as a sometimes amusing and sometimes semi serious swag at - handgrenade wise -keeping one's retirement in the ballpark.

Hence - I run a lot of 'what if's' on FireCalc and ORP - but don't directly use them - more for a 'sense' of what happened in various points/periods of history that might be relavant to 'my' ER.

Math is a wonderful thing. So is real life. With a big enough handgrenade and a willingness to adjust - :confused::confused:?

Bon Temps Rolliere!

Good point.
Some folks tend to get tangled in their undershorts on this topic far too much. Some seem to be looking for the "magic formula" that will give them their "number" for ER and all they will have to do is plug in some values and WHAM! your own personal number appears that you can use forever. SWR is one of many tools to use to get a general idea of what you can expect from a cerain pile of assets over a period of time based on historical data with some estimates of future inflation and asset growth. Like any other tool it has its' own limitations. You can't build a house with only a hammer and FIRE is much like building a house.

Use all the tools you can find but in the long run, the success or failure of your ER will be what you do every day, week and year. If you overspend the growth of your nest egg it will not be able to feed you later in life. If you underspend you will have a bigger egg. The size of your egg depends on your spending habits as much as the performance of your investments. Both are important but they are also fluid and what might work today may not work next year or in 10 years.

Keep a watch on your assets; control spending so you keep a cushion but don't deprive yourself so much it hurts; otherwise, why ER in the first place? Run the numbers but keep in mind that history is the past and there is no crystal ball that will give you a perfect picture of the future. Plan but don't get tied up in your shorts over the math. The data is too inexact to predict what will happen in the future to put too much credence on the numbers. Go with the flow but keep an eye on your nest egg. SWR is a tempest in a teapot most of the time. Use the tools that are out there but don't get too hung up on the exact numbers....they are not really exact since they are based on assumptions.
 
Cb said:
I think you can...just add the desired % to FIREcalc's annual portfolio expense to model higher inflation scenarios.
Oooh, nice idea. I'll try that.

Never mind, Dory-- dodged another bullet!
 
Well I am still intrigued by the Gummy withdrawal method. I had made the comment that having (the excess) money earlier was better than having (the excess) money later. The Gummy method dovetails very nicely with this concept.

Personally I beleive that the Gummy method gives some theoretical rigor to what retiree's probably do in real life. If you have a good year in the market then you just might spend a little more than your 4% SWR suggests and vice versa.


Quote from: MasterBlaster on February 09, 2006, 04:14:07 PM
Most ER's could use more cash early rather than later.


[quote from Nords]You're not providing any data to back that up, but the only study I'm aware of did not evaluate healthcare costs.

I'd suspect that most ERs in their 80s wish they had a little extra cash to avoid having to choose between prescriptions or food.
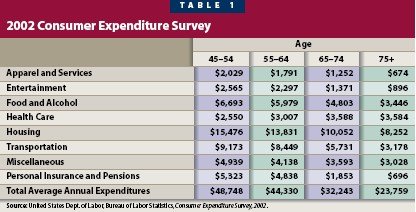
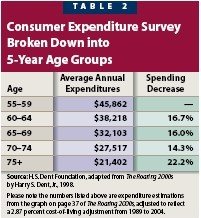
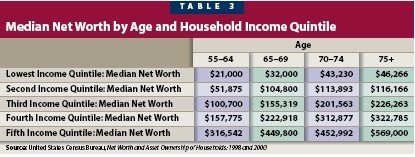
I found a reference to declining spending versus age. This is an article written by an actual finacial planner who watched many of his clients spending patterns as they aged.

http://www.fpanet.org/journal/articles/2005_Issues/jfp0605-art7.cfm

Compare these tables to traditional finacial planning where spending increases with inflation. Note from the tables that median spending decreases with age even though median net worth goes up. Also note that median inflation adjusted spending has been relatively constant when compared to a couple of decades ago.

Per your comment about healthcare: Notice that healthcare costs are included in the analysis.

here are some of the tables out of the article:
 

Attachments

  • BernickTable1.jpg
    BernickTable1.jpg
    35.2 KB · Views: 102
  • BernickTable2.jpg
    BernickTable2.jpg
    20.7 KB · Views: 113
  • BernickTable3.jpg
    BernickTable3.jpg
    31.3 KB · Views: 101
  • BernickTable4.jpg
    BernickTable4.jpg
    22.3 KB · Views: 99
  • BernickTable1.jpg_thumb
    18.9 KB · Views: 0
  • BernickTable2.jpg_thumb
    38.9 KB · Views: 1
  • BernickTable3.jpg_thumb
    15.6 KB · Views: 0
  • BernickTable4.jpg_thumb
    11.3 KB · Views: 0
I think theres a missing piece of data to actually cement the claim that spending goes down while income goes up. The spending patterns arent specifically linked to peoples net worth, but just laid alongside quintiles of net worth.

In other words, its possible that the people who continued to spend more slid from the 1st to 5th quintiles as a result, or that savers moved up from the 3rd to 1st quintiles. This data doesnt connect the dots.

Spending patterns have also changed, which might make the numbers for a 75 year old today different from a 50 year old 25 years from now. For example, my dad has little interest in PDA's, cell phones and computers. I'll probably want to have and have to buy all three.
 
You have a point about the rigor of the analysis. The analysis strongly suggests that spending declines with age but it is not a rigorous proof.

Still, the planner watched this scenario over many times that older people just didn't have the interest or ability to spend all of the money that their traditional spending plan warranted. After you've traveled around the world once or three times and the house is all fixed up and you are on your third new car in 6 years there just may not be all that much stuff that you aspire to. At least that's the implication of the paper.

to quote from the article:

The dramatically different spending tendencies between my firm's younger and older retired clients served as the catalyst for this study. Many of our younger retirees had problems spending within the income parameters of their retirement plans, while the majority of our older retirees were spending far less than what they could afford. It is my opinion that these spending tendencies hold the key to a much larger picture, which includes creating more realistic retirement projections by making adjustments to the traditional retirement planning approach.

regarding spending patterns, there will always be new cool stuff to buy. Also notice from Table 4 that for older people that spending had gone up around 10 % in the last twenty years. Still the past is not a prediction of the future...so who knows.
 
I'd like to see the same numbers broken out over the same pattern from 1980 or 1960, if the trend was the same, I'd say its pretty well cemented. I'd also like to see the actual method of collecting and consolidating the data, although I'm familiar with many of the BLS studies and they're not that bad. I do get a little queasy when I see stats pulled from someone book (the harry dent 'roaring 2000s').

I see the spending went up in table 4 but again, its a disconnected piece of data. Did it go up because it was voluntary? Does it show unaccounted for cost increases or "invisible inflation".

Strikes me that this is a great way to track "real" inflation in a prairie dog way. Actually how I track my own personal rate of inflation. If my spending for food goes up 15% from one year to the next, then food went up 15%. We dont tend to eat nothing but pasta one year and maine lobster tails the next. Similarly, by tracking the SAME GROUP'S spending from one year to the next, in major buckets like the ones shown above, it should be feasible, at least in year against adjacent year, to determine real inflation. Although that number would need to be slightly weighted by the alleged factor that aging reduces spending.

If you could establish a generic year on year uplift or drag down in spending as a function of age, then apply that to a broad based group of people in different income brackets, you could very easily and effectively measure true inflation for those groups measured. No need of baskets, buckets, or hedonics.

All that having been said, I believe people spend less as they age. I believe that in some income brackets there are hard decisions made on medicine vs food quality or a vacation. I believe health care is having and will have a profound and continued effect.

I have an interesting little "fish bowl" in observing my Dad's Sun City neighbors and talking with them. Mostly people in their 70's and 80's, fairly well to do, lots of available home equity as their homes have more than doubled in the last 5 years.

A small percentage travel a lot, mainly to gambling towns like reno and south tahoe. Very few japanese or german luxury cars. They do as a group like to spend money on things like the club house and golf courses, both of which are interestingly underutilized, but the end game is that they like to be able to take visiting friends and family to those places to show off how nice the place is and thats how they show their status. Just paid a fortune to have the roads re-oiled to make them "a deeper, darker black"...weirdest thing I've ever seen...the roads looked fine to me...apparently they just werent the right color. Everybody's up in arms about the new medicare stuff...a lot of people finding their meds are no longer covered or that they have to pay more when all they heard was that this new plan would save them money. A lot of heavy drinkers, but thats mostly in the closet. A lot of under-eating and eating of cheap weird cost saving food. Lady across the street from my dad bought about 200lbs of cheap beef roasts when they were on sale and is still eating them 2 years later, but has to cover them with barbecue sauce to cover the appearance of the long freezer burned meat (my dad avoids offers of dinner at her house). Lots and lots and lots of health problems. In fact I cant think of one household where at least one spouse isnt afflicted by something that limits mobility or travelability. Many couples rarely, if ever, leave the house except for necessities.

I'm going to bet that the 50-somethings of today will have a foreign luxury car rather than a buick or caddy in the garage. Maybe travel more. Plausibly eat better. The 'depression' influence wont be there for one thing.
 
MasterBlaster said:
Per your comment about healthcare: Notice that healthcare costs are included in the analysis.
I hear ya, but this sentence concerns me: "One limitation of this data includes the potential absence of long-term care costs. For example, a person in a nursing home is unlikely to participate in a survey from the Bureau of Labor Statistics. This would give the health-care-expenditures category artificially low average expenses."

IOW, as near as I can tell, they're saying that the data in Tables 1 & 2 doesn't include the costs of the heroic life-saving measures taken in the final year of one's existence. And I doubt that any of that final year is spent consulting with the financial advisor, either, as the family is busy liquidating the portfolio instead of rebalancing it.

So it's confusing to read that disclaimer and then see them base their Table 5 analysis on the spending reductions from Tables 1 & 2.

I'd much rather live an enjoyable life, one where I feel that our spending decisions have value as well as the constraints of a 4% SWR, and end with a big portfolio that's donated to charity. I suspect that the me I'll become in four decades will appreciate it too, and I'm certainly not willing to risk the alternatives based on that sort of research.
 
I expect my portfolio will not be so large that I'll be leaving a lot to anyone... :'(

I will use 4% as a rule-of-thumb, but certainly not blindly... :-\
 
Back
Top Bottom