You are looking at only a tiny bit of data. It's just too little from which to draw conclusions (about that fund or funds in general).
Use of CAPE to "time" the US market seems to work relatively well, but only over long periods (i.e. the "buy" and "sell" signals can be mis-timed for a >long< time, so it's useless as a tool for short-term trading). I personally believe I can use it to shift my AA a little bit, but am not confident enough in it to use it for "all in/all out" moves.
Due to inefficiencies in international equities investing (case: China's restrictions on selling, "captured" money from their domestic investors, etc) and some structural changes that make long-term CAPE trends in some countries suspect as a key to understanding the future (Case: Greece today is not the investing environment of Greece 1990), I am less confident in the utility of CAPE internationally than here in the US.
NASDAQ and the S&P 500 are the only indexes I'm familiar with. Between the two, the S&P 500 is the only one whose symbol I currently know ($SPX) so I can get it to show up on the chart that I use for comparisons. I found an ETF that tracks NASDAQ that I decided is good enough for me to buy. I figure that's close to the S&P 500, so S&P 500 = good. Anything more volatile than it = scary. Anything that tracks it closely = what's the use? I want something close to the inverse of the S&P, or at least independent of it without being too risky. We've had recent weirdness in the US of the kind that I want protection from so I don't feel like I have to check too far back, though maybe it's different with CAPE.
You want to arrange your asset allocation so that your whole portfolio gets good performance (i.e. return) and has volatility that you can accept, right? The commonly accepted way to do that is to use many types of volatile assets that are not well correlated, but which each have good returns. If going by this approach, an investor really really doesn't care about the volatility of each asset, provided that asset earns good volatility-adjusted returns >ad< he's got another part of his portfolio that he expects to be negatively correlated to it (or, at least uncorrelated to it).
We've had recent weirdness in the US of the kind that I want protection from so I don't feel like I have to check too far back, though maybe it's different with CAPE.
If you truly believe that our markets are now in uncharted territory ("it's different this time"), then neither CAPE nor any other historically-based
guide to the future will be of much use.
Yes. I'm doing the index fund thing which is more than a lot of people do. I looked for bond funds and I'll give that another shot but I don't care very much any more about bonds. I'm not sure that they "have good returns." I just know they have lower returns than stock. And I'm looking for a foreign fund now.
If you truly believe that our markets are now in uncharted territory ("it's different this time")...
I do but maybe not by a whole lot. That's why I'm using last November to represent general weirdness that includes past recessions, but I may go back further.
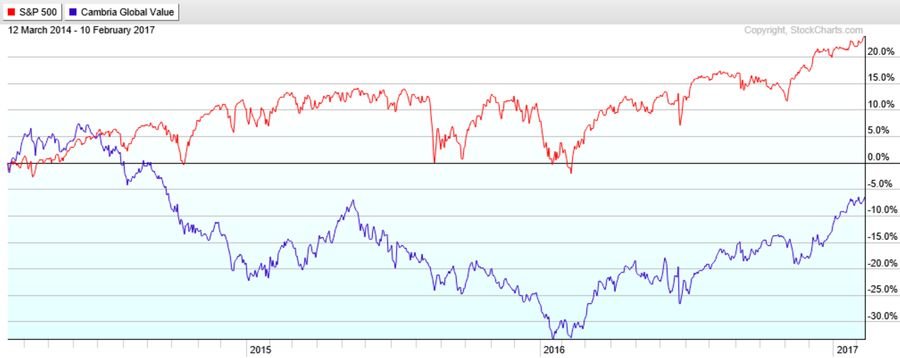
I guess what I was trying to get at is that comparing a global fund to US large equities index seems not very helpful to me. I guess if you're default investment is US large equities, then you can say what you said (glad you didn't invest in it). Out of the various ways to categorize investments, there are going to be winners an losers for various time periods. There was a big chart posted, MidPack?, that showed which asset classes did better or worse every year for a bunch of years. It just looked so random. Picking one to compare all the others against seemed kind of weird if one discounts the fact that we happen to live in the place where these big companies started and have their HQ.