REWahoo
Give me a museum and I'll fill it. (Picasso) Give
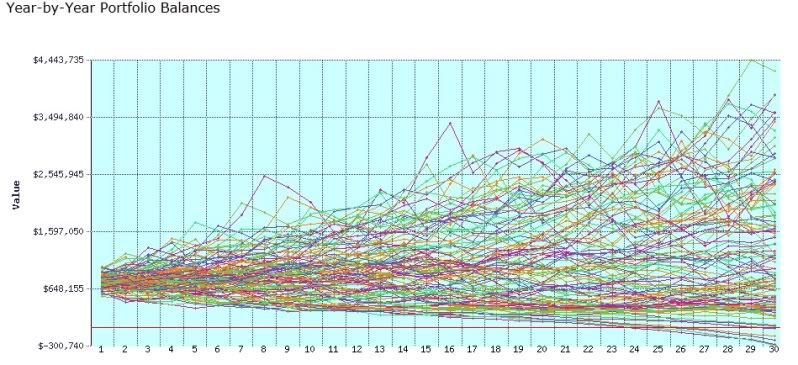
I don't think I'm the only one here who has run FIRECalc and looked at the 'spaghetti chart' showing the indecipherable tangle of year-by-year portfolio balances - and wondered "what will my chart look like in five, ten or 25 years?" Where will my lonely single line go and what story will it tell?
Spaghetti chart example using default FIRECalc numbers:
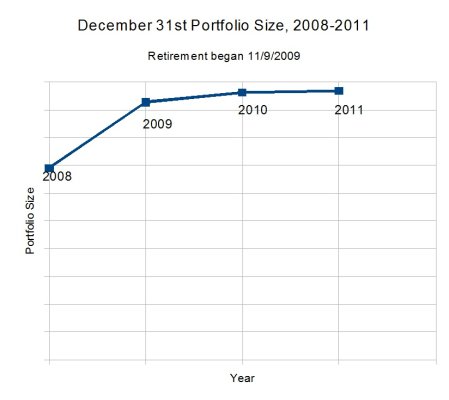
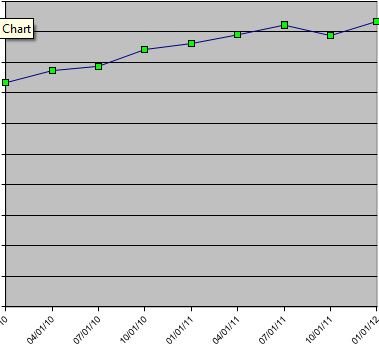
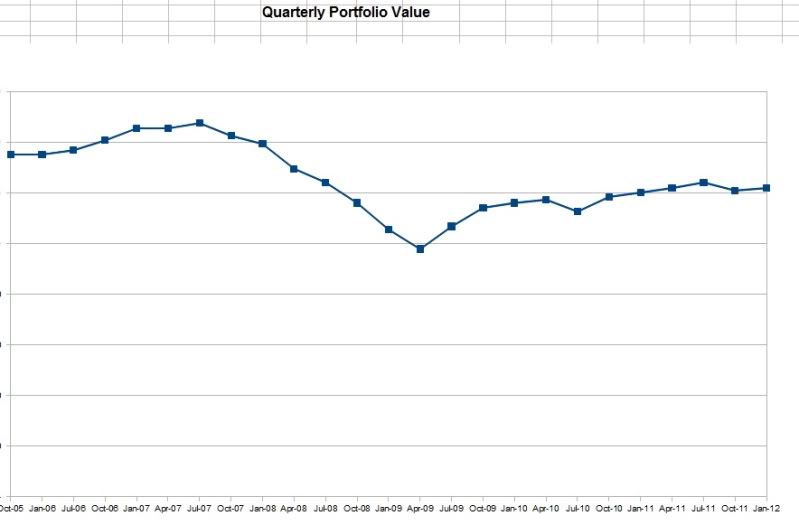
While I don't know what my individual line will look like in 10, 20, or 30 years, I do know what it looks like after six and a half years of retirement:

Adding fuel to the "what's a reasonable SWR?" debate, here's my somewhat shameful track record of withdrawals:
2006 - 4.9% (portfolio withdrawals were sole source of income)
2007 - 9.8% (portfolio withdrawals were sole source of income)
2008 - 7.9% (portfolio withdrawals were sole source of income)
2009 - 6.1% (I began receiving SS benefits in Feb.)
2010 - 5.4% (DW began receiving SS benefits in May)
2011 - 4.2%
2012 - 3.9% (projected - I go on Medicare)
2013 - 3.5% (projected - DW switches from high risk pool to Medicare in April and begins receiving small non-COLA pension)
2014 - 3.2% (projected)
EDIT: All percentages are based on the initial portfolio value.
The nosebleed percentages in 07 and 08 were primarily due to the purchase of a motor home and other RV related spending. I expect those were one-time events and are part of our front loaded, enjoy-it-while-you-still-can spending strategy (I'm 65).
Locked and loaded, hunkered down for incoming. Fire away...")
Spaghetti chart example using default FIRECalc numbers:
While I don't know what my individual line will look like in 10, 20, or 30 years, I do know what it looks like after six and a half years of retirement:
Adding fuel to the "what's a reasonable SWR?" debate, here's my somewhat shameful track record of withdrawals:
2006 - 4.9% (portfolio withdrawals were sole source of income)
2007 - 9.8% (portfolio withdrawals were sole source of income)
2008 - 7.9% (portfolio withdrawals were sole source of income)
2009 - 6.1% (I began receiving SS benefits in Feb.)
2010 - 5.4% (DW began receiving SS benefits in May)
2011 - 4.2%
2012 - 3.9% (projected - I go on Medicare)
2013 - 3.5% (projected - DW switches from high risk pool to Medicare in April and begins receiving small non-COLA pension)
2014 - 3.2% (projected)
EDIT: All percentages are based on the initial portfolio value.
The nosebleed percentages in 07 and 08 were primarily due to the purchase of a motor home and other RV related spending. I expect those were one-time events and are part of our front loaded, enjoy-it-while-you-still-can spending strategy (I'm 65).
Locked and loaded, hunkered down for incoming. Fire away...
Last edited: