Portfolio Required v Equity Asset Allocation

Midpack

Give me a museum and I'll fill it. (Picasso) Give me a forum ...
Joined
Jan 21, 2008
Messages
21,318
Location
NC
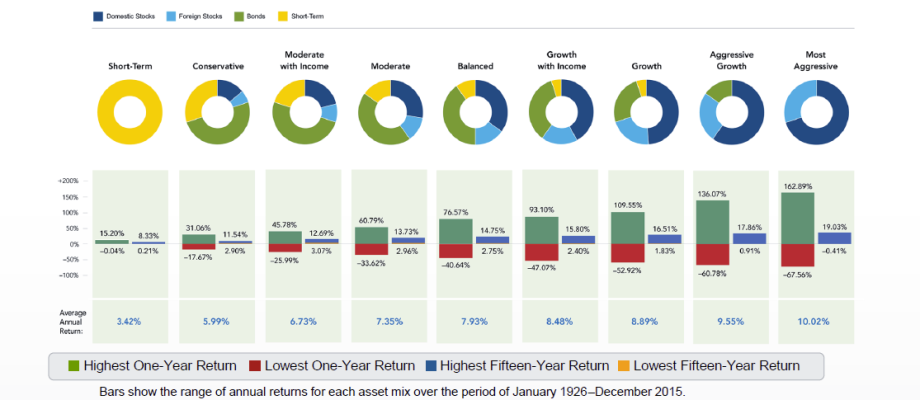
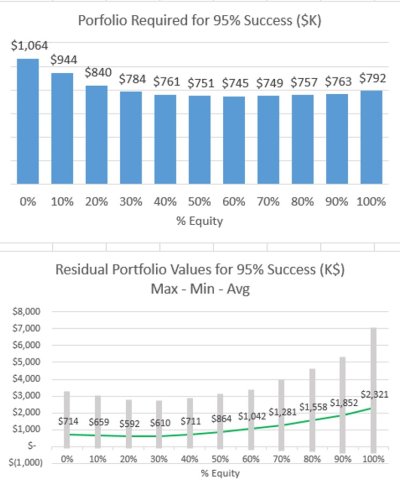
This has been done a few times, but it's been a while? Occasionally there are posts here about changing allocation slightly and usually the replies say it doesn't make much difference +/- 10% equity or even more. So here's what the FIRECALC database returns for spending $30K/yr inflation adjusted over a 30 year retirement at a 95% success rate. The point is not the $ amounts (e.g. we all know the outlook for fixed income/interest is less optimistic) - the point is what's required in relative terms at each AA. I hope we can leave the future returns prediction debates out of this.

There's not much difference between 30:80 and 80:20 in terms of success rate or portfolio required - that's all this exercise was meant to illustrate. One could argue the AA decision hinges largely on residual values.

And staying out of equities altogether (0% on chart) requires a portfolio 43% larger than being 60% in equities - that's a lot of extra years working, or considerably less spending. And with the current outlook for fixed income, the premium to exclude equities is even greater. I remember one very persistent zero equity member, but I don't know if we have any zero equity allocation investors left here?

I'm tempted to summarize other conclusions, but I'll let the audience draw their own, and there are others more qualified here anyway.

It may also help illustrate the risks of trying to time out and back into equities.
 

Attachments

  • Picture1.jpg
    Picture1.jpg
    92.6 KB · Views: 141
Last edited:
What is the annual withdrawal in this example? I assume all are drawing the same $$ amount annually?
 
What is the annual withdrawal in this example? I assume all are drawing the same $$ amount annually?
$30K, I'll edit the OP thanks. I was prob overly cautious trying to avoid bickering about future returns and the exact numbers - not what I was trying to illustrate.
 
Last edited:
I am glad you posted this. It’s something I discovered a few years back when entering my retirement glide path.
 
I always raise eyebrows/cock head when I read someone here talking about rebalancing in small increments like 1% or even 5%. It has seemed to me that adjustments that small would have little or no effect. Your charts confirm this for at least the middle AA range. Good post. Thanks.
 
Thanks for posting this. Quick question … what does the 2nd chart "residual portfolio" represent? I would have guessed it would be the avg amount left over after 30 years. But then I am surprised that a 0% equity portfolio would have more left over than a 10-40% equity portfolio? 0% shows $714k whereas 20% shows $592k.
 
I always raise eyebrows/cock head when I read someone here talking about rebalancing in small increments like 1% or even 5%. It has seemed to me that adjustments that small would have little or no effect. Your charts confirm this for at least the middle AA range. Good post. Thanks.

I've wondered what the meaningful band is myself (generally speaking). 10%? 20%?
 
What would be interesting and I am not sure how you would do it, is to overlay the standard deviation or level of bounciness of each equity level. That would introduce SORR into the example.
 
Thanks for posting this. Quick question … what does the 2nd chart "residual portfolio" represent? I would have guessed it would be the avg amount left over after 30 years. But then I am surprised that a 0% equity portfolio would have more left over than a 10-40% equity portfolio? 0% shows $714k whereas 20% shows $592k.
You’re right on what the second chart represents.

I just reran the numbers to confirm the chart results, as for a moment I might also have guessed a 0:100 would underperform 20:80. But note the portfolio size required for 0:100 is quite a bit larger than 20:80. If you compare residual as a percent of starting portfolio for each, I suspect your intuition would be confirmed. Or stated another way, if the starting portfolios were all the same, the chart would be as you expected - but the success rates wouldn’t, and I was using comparable success rates as a given.
 
Last edited:
So to understand the second chart as a ratio of residual to starting, the higher equity portfolios would be more dramatically skewed to the right if they started out with the same amount? Every time I see one of these I am inclined to lean more heavily to equities.
 
Thanks for the work you did for this illustration. My take from the data is I still feel comfortable at 75% equities investments.
 
$30K, I'll edit the OP thanks. I was prob overly cautious trying to avoid bickering about future returns and the exact numbers - not what I was trying to illustrate.
This also then translates to the withdrawal rate for 95% success for each allocation which is generally useful information.
 
I always raise eyebrows/cock head when I read someone here talking about rebalancing in small increments like 1% or even 5%. It has seemed to me that adjustments that small would have little or no effect. Your charts confirm this for at least the middle AA range. Good post. Thanks.
How does the chart illustrate this? Except for 100% bonds or 100% equities, all allocations are being rebalanced annually, regardless of their drift. And rebalancing is a mechanism to manage year to year volatility and overall SORR, not to maximize long term returns. The fact that the 60/40 allocation is able to achieve the same success rate as the others with the lowest starting portfolio illustrates this.

Oh, I suppose you mean not much difference between the 50/50 to 70/30 required starting portfolios. True. Probably a bit more difference in their worst case annual volatility.
 
Last edited:
I always raise eyebrows/cock head when I read someone here talking about rebalancing in small increments like 1% or even 5%. It has seemed to me that adjustments that small would have little or no effect. Your charts confirm this for at least the middle AA range. Good post. Thanks.
Does it actually confirm it? Should one not rebalance at all, or wait until it is way off, like 20%? Then you'd be doing a significant rebalance, which I'd be a little skittish about.

Rebalancing lets you buy low and sell high, relatively. It's not going to make a major difference. Very few of the things we talk most about make a major difference in your long term finances. A series of small things can make a worthwhile difference. That's why I'm going to examine and execute on when to take SS, how much of my Roth to convert, and other such decisions that potentially make a little difference. I view rebalancing as one of those small things.

The majority of my rebalancing comes when I either need money to live on, or have an influx of money from some event. I sell off the overweight class, or buy the underweight, to get back in balance. But there has been an occasional time where I've moved assets from one class to another. That is usually done in my Roth or tIRA where it's not a taxable event. 5% is my rough guideline. Feel free to arch your eyebrows. I still feel fine about it.
 
How does the chart illustrate this? Except for 100% bonds or 100% equities, all allocations are being rebalanced annually, regardless of their drift. And rebalancing is a mechanism to manage year to year volatility and overall SORR, not to maximize long term returns. The fact that the 60/40 allocation is able to achieve the same success rate as the others with the lowest starting portfolio illustrates this.

Oh, I suppose you mean not much difference between the 50/50 to 70/30 required starting portfolios. True. Probably a bit more difference in their worst case annual volatility.
For example, there was a post a short while back with a member asking if he/she should cut back from 60:40 to 50:50, and there are others periodically. The difference in returns or success is relatively small, that's what I was trying to illustrate.

Unless you go to extreme asset allocations, there's not a huge difference between 30:70 and 70:30 in returns or long term success. The latter returns a little more, but it's a significantly more extreme ride from peaks to troughs. The troughs which can last days, weeks, months or even years test the resolve of investors. For many, looking at the expected 1 and/or 15 year downsides may be more important than projected returns to pick an AA - what's the maximum downside you can stomach/hold the course and still sleep at night during recessions? Panic selling can kill results.
 

Attachments

  • invest_401k_diversification.png
    invest_401k_diversification.png
    122.1 KB · Views: 61
Last edited:
Unless you go to extreme asset allocations, there's not a huge difference between 30:70 and 70:30 in returns or long term success. The latter returns a little more, but it's a significantly more extreme ride from peaks to troughs.
I read the charts as indicating the expected return (residual value) is much higher for the higher equity portfolios.
 
... Oh, I suppose you mean not much difference between the 50/50 to 70/30 required starting portfolios. True. ...
Exactly. I also recall an advertising chart from one of the new kids, Betterment or Wealthfront, showing the financial advantage of their automatic rebalancing at like 0.5%. Not to be ignored, to be sure, but not enough IMO to create an extreme sense of urgency.

... Probably a bit more difference in their worst case annual volatility.
Probably. But I think concern about volatility and, in particular, conflating it with risk is really overblown. Most smart retirees, here especially, have an AA or a bucket strategy that minimizes SORR. Once that risk is covered, volatility becomes almost a don't care. And during the accumulation phase regular savers are effectively dollar cost averaging and volatility should probably be considered to be A Good Thing. Here is a hypothetical graphic that we discuss in my Adult-Ed investment class:

38349-albums210-picture2094.jpg


The horizontal axis is the accumulation phase, from beginning of savings to near-retirement. The vertical axis is overall stock market value.


... I view rebalancing as one of those small things. The majority of my rebalancing comes when I either need money to live on, or have an influx of money from some event. I sell off the overweight class, or buy the underweight, to get back in balance. But there has been an occasional time where I've moved assets from one class to another. That is usually done in my Roth or tIRA where it's not a taxable event. 5% is my rough guideline. Feel free to arch your eyebrows. I still feel fine about it.
Yup. Nothing wrong with any of that, including your view of rebalancing as one of the small things. No reason for you to worry about the state of my eyebrows.

Thinking about this/this thread, maybe rebalancing thresholds ought to vary depending on AA. For example, consider a 10/90 or a 90/10. Letting things go even to 5% means that 10% slice is half of what the investor wants or one-third more. It's all kind of subjective, how you view the small slice and what the reason was for the 5% AA change. Just noodling here ...
 
I read the charts as indicating the expected return (residual value) is much higher for the higher equity portfolios.
They are higher as you'd expect, but with higher upsides and lower downsides. Pick your poison so to speak. Higher residual value is a priority for some, and a lower priority for others. And remember these charts reflect different portfolio starting amounts which alters the charts some, most charts probably assume one portfolio starting value.
 
Last edited:
... Interesting look from a different angle.

Actually I show them several different market appreciation curves and ask the class, as savers for retirement, which they would prefer. All of the curves come to the same point at the end. Few of them pick the correct one:

38349-albums210-picture2095.jpg


It's kind of counterintuitive but during the accumulation phase you want the market to stay low.
 
Yup. Nothing wrong with any of that, including your view of rebalancing as one of the small things. No reason for you to worry about the state of my eyebrows.

Thinking about this/this thread, maybe rebalancing thresholds ought to vary depending on AA. For example, consider a 10/90 or a 90/10. Letting things go even to 5% means that 10% slice is half of what the investor wants or one-third more. It's all kind of subjective, how you view the small slice and what the reason was for the 5% AA change. Just noodling here ...
I don't believe in rebalancing in small % increments, at least in taxable, for tax reasons. I've always used the 5%/25% rebalancing rule. I keep AA in mind when I'm making taxable withdrawals for spending, and I'm going to take a tax hit anyway, as an opportunity to correct AA.

It's a waste of time to me, but rebalancing to small % increments in tax sheltered accounts doesn't hurt anything. I knew co-workers who rebalanced all their 401k holdings to exact numbers, even holdings that were off 0.01%. Didn't occur to them the % would probably change that much daily...

https://awealthofcommonsense.com/2014/03/larry-swedroe-525-rebalancing-rule/
 
Last edited:
I read the charts as indicating the expected return (residual value) is much higher for the higher equity portfolios.

You basically get to trade-off between short-term volatility and residual portfolio. So higher equity allocation does have a likely short-term cost to offset the potentially larger long-term gain.

So it ultimately comes down to an individual’s goals and personality.
 
But I think concern about volatility and, in particular, conflating it with risk is really overblown. Most smart retirees, here especially, have an AA or a bucket strategy that minimizes SORR. Once that risk is covered, volatility becomes almost a don't care.
From the messages posted here from retirees, especially new retirees and those depending solely on their investments to fund their retirement, short-term volatility (annual, a few years) is often of great concern.

Each individual has to select their trade-off, but I don’t consider it overblown at all. It’s a real issue and very dependent on personality and goals. Being able to stick to a plan in the face of 2000-2002 and then 2007-2009 can be extremely challenging.
 
I don't believe in rebalancing in small % increments, at least in taxable, for tax reasons. I've always used the 5%/25% rebalancing rule. I keep AA in mind when I'm making taxable withdrawals for spending, and I'm going to take a tax hit anyway, as an opportunity to correct AA.

It's a waste of time to me, but rebalancing to small % increments in tax sheltered accounts doesn't hurt anything. I knew co-workers who rebalanced all their 401k holdings to exact numbers, even holdings that were off 0.01%. Didn't occur to them the % would probably change that much daily...

https://awealthofcommonsense.com/2014/03/larry-swedroe-525-rebalancing-rule/
The models are demonstrating the benefits and trade offs of simple annual rebalancing at start of year, and don’t reflect anything about using triggers for rebalancing.

BTW - what investments are actually being used in the models. For fixed income and for stocks? The FIREcalc default is total stock market and long interest rate. Personally I wouldn’t touch long bonds for fixed income, and suspect they would make survival worse. I use 5 year treasuries when I run my models.
 
Last edited:
From the messages posted here from retirees, especially new retirees and those depending solely on their investments to fund their retirement, short-term volatility (annual, a few years) is often of great concern.

Each individual has to select their trade-off, but I don’t consider it overblown at all. It’s a real issue and very dependent on personality and goals. Being able to stick to a plan in the face of 2000-2002 and then 2007-2009 can be extremely challenging.
All true, but IMO a worthwhile candidate for education. Again completely IMO, fear of short-term volatility (assuming SORR is handled) really costs people in portfolio yield. Is that cost worth paying? Do people even understand that fear of short-term volatility costs them? Probably any cost is acceptable to some.
 
Back
Top Bottom