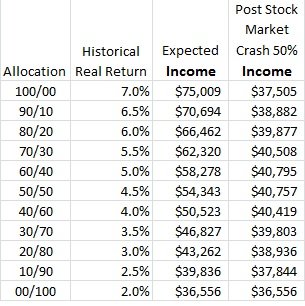
I do use firecalc and it is a good downside tool. But I am not sure it fully addresses what an appropriate expected income would be.
Okay, everybody sees and learns things a bit differently. FWIW, here are some depictions of interest. Assumption: $750K starting value, withdraw 4% of the end-of-year balance each year. The graphs show the actual real value of withdrawals (starting-year dollars). The text boxes address the value of the portfolio itself.
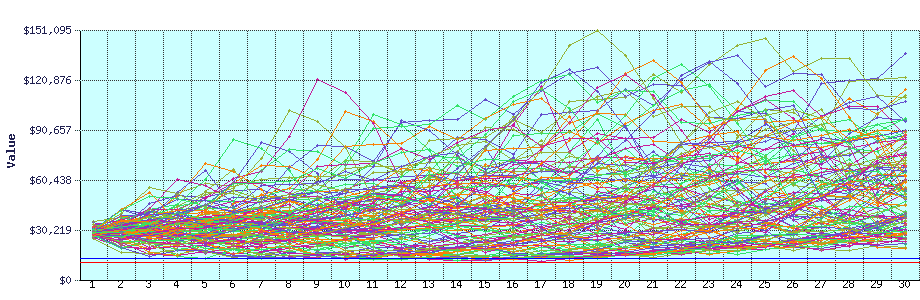
Here's the graph for 100% equities.
(see "100S.png" attachment
Here is how your portfolio would have fared in each of the 114 cycles. The lowest and highest portfolio balance throughout your retirement was $514,458 to $3,493,756, with an average of $1,462,771. (Note: values are in terms of the dollars as of the beginning of the retirement period for each cycle.)
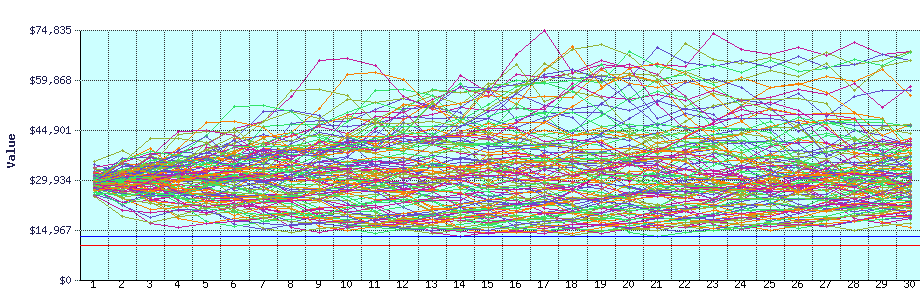
Here's the 50s/50b output:
(see "50-50.png" attachment)
Here is how your portfolio would have fared in each of the 114 cycles. The lowest and highest portfolio balance throughout your retirement was $420,843 to $1,828,852, with an average of $834,382. (Note: values are in terms of the dollars as of the beginning of the retirement period for each cycle.)
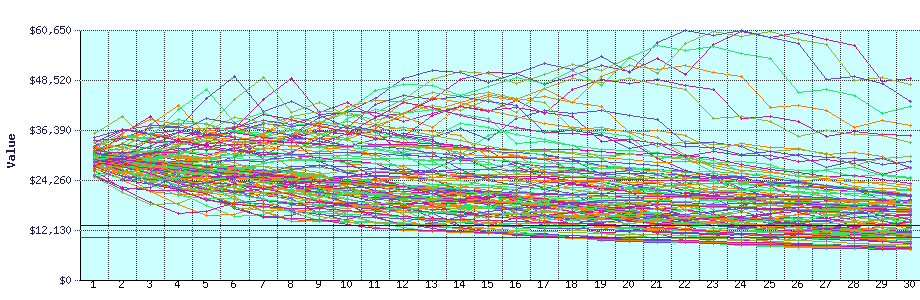
Here's 100% bonds (5 year Treasuries):
(See "0S.png" attachment)
Here is how your portfolio would have fared in each of the 114 cycles. The lowest and highest portfolio balance throughout your retirement was $182,321 to $1,214,530, with an average of $415,388. (Note: values are in terms of the dollars as of the beginning of the retirement period for each cycle.)
Takeaways:
- Stock prices sometimes don't just drop in a one-time plunge, but they can descend and then stagnate at low levels. So, if we look at the first 8 years of each depiction above and we especially look at how many of each lines approach the blue "poverty level" line. Over that first 8 years, this happens much more frequently for the 100% stock portfolio than the 50/50 or the 100% bonds portfolio. This is the "shallow" risk (volatilty) that
galeno mentioned, and it's what people try to avoid by having more bonds. The construct of your sample spreadsheet doesn't do a good job of showing this risk, I think FIRECalc helped me understand it better.
- Now, look at all three charts at 20-30 years. Many of the lines on the 100% bonds chart have dropped below the poverty level, and none of the lines for the 50/50 or 100% stock portfolio have done so. The 50/50 and 100% stock portfolios help avoid this deeper risk--long term failure to keep up with inflation.
- Other: Be sure to observe the scales on the Y axis--they vary a lot across the three depictions.
So, this is why people choose balanced portfolios. They are the "sweet spot" and minimize both shallow risk (volatility) and deep risk (losing value to inflation). FIRECalc (and other models) can do a lot to help illuminate these issues, within their limits.
Good luck