Stocks looking a lot like April

dex

Give me a museum and I'll fill it. (Picasso) Give me a forum ...
Joined
Oct 28, 2003
Messages
5,105
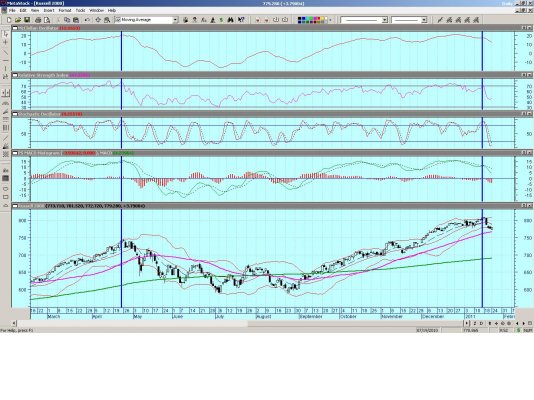
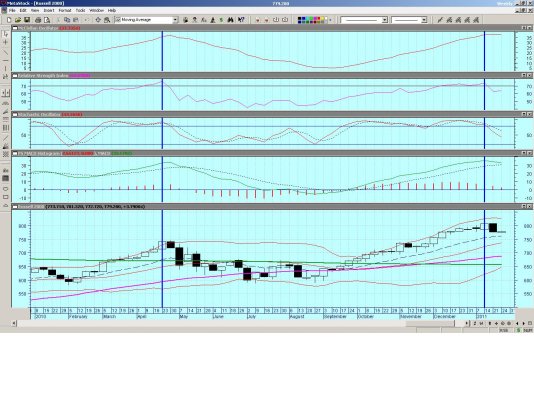
These charts are of the Russell 2000, the index that led the market up.
It is looking a lot like April.
Anyone lightening up on stocks?

First is the daily
Second is the weekly
Take a look at the heavy vertical blue lines.

Also, it has started to bounce along the lower bollenger band on the daily.

Don't put too much weight on the January Barometer.
http://seekingalpha.com/article/114581-how-accurate-is-the-january-barometer
 

Attachments

  • weekly.jpg
    weekly.jpg
    283.7 KB · Views: 32
  • WkWk.jpg
    WkWk.jpg
    268.6 KB · Views: 25
Dex, I thought you went to all cash. Why are you fretting over bolinger bands?

I may put in a small short this week. There is a Fed action or meeting on Wed. that could pop the market up a bit more.
 
I don't know Dex, I think I'm gonna pass on your lead. But who knows, you may get lucky since you got skunked the last time. Good luck!
 
Since stocks in general are slightly overvalued (in my own estimation), I am slightly underweight stocks. I have cash at the ready to buy more equities on a pullback.
 
The headline markets (Dow, Dax, etc) are up a couple of points on last week, but my emerging markets and Asia funds are all down. :(

This race-to-the-bottom with currencies is hurting my numbers, too. Every time I gain 5% on US/UK stocks, the Euro - which everyone tells me is about to "collapse" - gains another 3% on the $/£ and that's half my gain gone. The best thing that could happen to my portfolio is a 10% drop in the Euro.
 
:confused: Are you in the right forum?
 
I've been selling equities, but it hasn't anything to do with astrological star charts. But considering the "success" of the last "sell signal" (SPX up 20% in 5 months, 55% annualized) I should reconsider and move all-in.
 
I guess we know "whaddaya do all day" in Dex' case.

What is next? Market divination via the entrails of a chicken?
 
:confused: Are you in the right forum?
If you mean me: I'm just b*tchin'. :D

I check the BBC 6-item market ticker every day - the numbers have all been green for a week. Then I make my twice-weekly visit to my online accounts and all of my stock-based funds equities are off by 2-3%. 10K down in a week hurts more than 70K up in the past 5 months (which of course was partly due to the Euro softening a little).
 
I seem to see a head-and-shoulders top just above the breakout of the MACD stochastic. I am waiting to hear what Cramer says about it today.
 
I see an upside down coffee cup and I'll wait to see what Suze has to say about it tonight.
 
Nobody knows what equity prices will do, but we all know that Mr. Bernanke wants them to go up and hang around those levels for a while. Seein' how he's in charge of the printing press and got the whole place working overtime, I'm thinkin' he's gonna get what he wants. I'm sure not gonna bet against him.
 
I see big breasts, and I'm going to wait and see what Craig Ferguson says tonight.
 
April who? :blink:


Sorry, Dex, your thread title just plain tickled my funny bone. :D

To answer the question you asked... No, I am sticking with my 40/60 AA plan. If anything, my temporary cash (13% in a VG NY TE money market bond fund) position will be utilized before June. I just haven't decided what I will do with it.
 
We might rebalance a little out of Berkshire Hathaway and some small-cap value ETF shares, but that's only if they go outside their asset-allocation band.

Unfortunately that's nowhere near as exciting as technical analysis. Those guys get all the hot chicks.
 
This is the chart I'm looking at
S&P 500 PE Ratio Chart
Combined with the second figure (scatter plot) here
P/E ratio - Wikipedia, the free encyclopedia
... which means that I'm liquidating as sell criterias get hit and either put it the money into short/medium duration bonds and low beta dividend stocks.

I'm not trying to hit anything dynamically. It's more the observation that statistically speaking market P/E > 20 never bodes well for long-term performance, like never ever. Granted, I may feel rich for a year or two if I hang on, but it would be hard to find the exit point. I will, therefore, forgo all the excitement and just start getting out now.
 
This is the chart I'm looking at


The PE-10 chart is one that many of us refer to. Something else that's worth noticing in the chart, though, is that the SPX has been over 20x almost consistently for the past 20 years, which makes it a little bit weak as an investing indicator for most of us mere mortals.

One reason PE-10 may not be mean reverting to historic norms is that corporate profit margins have been persistently above historic norms. Rather than correct in the Great Recession, margins have increased. So trailing and expected PE both look very reasonable while PE-10 looks overvalued. Those who swear by PE-10 swear that corporate profit margins will mean revert, but they haven't, and it's not clear when they will, or what would drive that.
 
What is next? Market divination via the entrails of a chicken?
One of my favourite quotes from Peter Lynch:
Thousands of experts study overbought indicators, oversold indicators, head-and-shoulder patterns, put-call ratios, the Fed’s policy on money supply, foreign investment, the movement of the constellations through the heavens, and the moss on oak trees, and they can’t predict markets with any useful consistency, any more than the gizzard squeezers could tell the Roman emperors when the Huns would attack.
 
Those who swear by PE-10 swear that corporate profit margins will mean revert, but they haven't, and it's not clear when they will, or what would drive that.
A fundamental fact of capitalism is that aggregate ROA and thus profit margins must revert to the cost of capital. Why it seems to be hung up now I really don't know, but if one can trust anything it ought to be this. A least I would rather trust reversion than a continued high plateau, though it clearly is not something a prudent person would want to bet either on or against.

Ha
 
This is the chart I'm looking at
S&P 500 PE Ratio Chart
Combined with the second figure (scatter plot) here
P/E ratio - Wikipedia, the free encyclopedia
... which means that I'm liquidating as sell criterias get hit and either put it the money into short/medium duration bonds and low beta dividend stocks.

I'm not trying to hit anything dynamically. It's more the observation that statistically speaking market P/E > 20 never bodes well for long-term performance, like never ever. Granted, I may feel rich for a year or two if I hang on, but it would be hard to find the exit point. I will, therefore, forgo all the excitement and just start getting out now.

This is the dilemma- play momentum, or stick to time tested value parameters?

Here is a good essay by Jeremy Grantham, IMO the thinking man's momentumist.

https://www.gmo.com/America/CMSAtta...A3FtEfm78jwhK2raeUlkG5dug64hyAKysCKa4ldy3iQ==

Ha
 
A fundamental fact of capitalism is that aggregate ROA and thus profit margins must revert to the cost of capital.

But cost of capital isn't fixed.

I don't think we can assume that higher than historically average profit margins means firms are earning "economic profits" in aggregate. If there is some calculation that shows this, I've never seen it, but would like to.
 
Back
Top Bottom