SWR, terminal values, TIPS, I-bnds & comm paper

Re: SWR, terminal values, TIPS, I-bnds & comm pape

Dory's analogy about umbrella's and rain buckets to explain the difference between SWR and average terminal value simulation made me think a little (and that's a good thing). But after some thought I'm convinced the argument doesn't hold water.  :) Sorry, I just had to find a way to put that stupid pun in this post.
Well, it doesn't seem quite right to me, but I may be all wet. :D

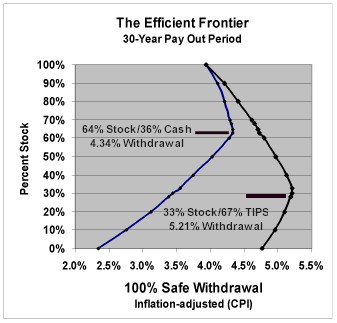
All in all, the research on asset allocation and the "efficient frontier" pretty much addresses all this stuff, doesn't it?

Here's the graph from the REHP:

recht1.jpg


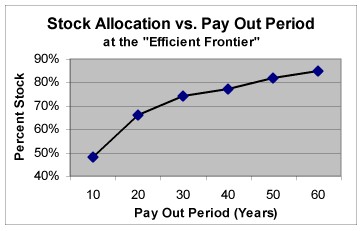
When Intercst published this about 4 years ago, many of us ran to our SWR calculators and found that these allocation mixes were, in fact, the best over the historical periods we have been looking at.

Dory36
 
Re: SWR, terminal values, TIPS, I-bnds & comm pape

Lets hope the research is valid because the the curve fits my ballpark for 60-70% stock(counting my 'hobby' stocks) and 25 yr. span (my old 84.3 IRS no.).

Now - being the eternal putzer, I'm sitting here reading the Vanguard target retirement series wherein the asset mix slides/changes over time finally landing at 75% fixed (including 25/% inflation indexed) for when your really old say your 70"s. Fidelity and and T. Rowe Price have similar offerings.

I assume they read the same research we do so I wonder what "assumptions" they are using for their 'customers'. It looks like lowering std dev (risk?) as you age is a prime driver with the ability to consume principle - spend down to your last dollar as side benefit.

?? How do you compare the two??
 
Re: SWR, terminal values, TIPS, I-bnds & comm pape

Gee Dory - I guess we just get wrapped up in the discussion and forget what has been done. I looked back at the REHP site and found this:
effic30.jpg


Which looks a lot like SG's graph. I still wonder how the shape of the curve changes when moving to 40 and 50 year plans.

Unclemick - In regard to packaged retirement target funds. I suspect that they want to target investors who have heard the conventional folklore that bonds are for retirees, so they have to weight it on that side. Remember it is still a mutual fund and makes the producers money only if people invest in it!

Also, I wonder what happens if we run calculations with the future variations set to either 50% or 150% of history....maybe they have different assumptions?

Now, back to the asset allocation question. I think my earlier comments were a little muddled - I'm not a good riter! The SWR studies have determined the optimal asset mixes to maximize the current SWR. There is mention of different mixes providing higher terminal values, but little detail on the advantage of them beyond "future higher withdrawals". I stated some calculated numbers above, but have not run enough tests to plot a graph, on one possible additional measure that could be easier to understand. I called it the "5 year SWR" and just put the data inline. The 5 year SWR was defined as the SWR supported by the average portfolio after 5 years. Here it is in more of a table:

Some data for a 1mil portfolio in equity and tips@2.5 for a 30 year plan:

mix initial SWR 5yr SWR
75% equity, 25% tips $46700 $60782
25% equity, 75% tips $46400 $54853

This is an attempt to quantify the upside of different asset allocations from a SWR point of view. A 10 year SWR point could also be added. After taxes are done, I think I will try to calculate more data points and graph them.

In any case, the earlier question was about asset allocation and SWR. I think SWR provides one input to an asset allocation decision, and potential upside provides another. Your own preferences on the value of that upside, personal preferences for or against tips, bonds, etc. are also factors. It isn't as simple as picking the optimal SWR.

Wayne
 
Re: SWR, terminal values, TIPS, I-bnds & comm pape

The "efficient frontier" graph posted by WZD on Jan 25 makes a lot of sense conceptually, in that it indicates that TIPs will support a substantially higher SWR than commercial paper as the "fixed income" component of a portfolio.  However, two things bother me about it.  First, I'm not sure what interest rate was used for the TIPs.  

More importantly, however, I assume that the rate of return used for the stock portion was the actual historical rate of return, which amounts to a real return of about 7.5% per year.  I think that the intelligent way to view historical data is to understand not only what happened, but why.  Future projections should not be "blind" projections of past trends, but rather should consider the "why" and try to anticipate what conditions are likely to be different in the future, and how this will be likely to cause future trends to vary from historical ones.  For various reasons, I think that it is both logical and prudent to estimate that the future real rate of return on stocks will be about 2% below the historical trend.

This has important implications for asset allocation, in that it makes TIPs relatively more attractive and substantially increases the theoretically optimal allocation of TIPs relative to stocks.

To generate my own version of the "efficient frontier," I ran FIRECalc with inputs modified to (I think) reduce the average return on stocks while maintaining a return on TIPs of 2.25% (plus inflation).  I did this by assuming that annual expenses for the portfolio would actually be 0.25%, but I entered 2.25% to artificially reduce the portfolio return by 2%.  But then, I set the return on TIPs to 4.5%.  (I used a 30 year period and the CPI for inflation adjustment.)  Here are the rather surprising results:

STOCK %          95% SWR          100%SWR

80                           3.76%              3.32%

60                           4.05%              3.64%                  

40                           4.23%              3.92%

30                           4.29%              4.05%        

25                           4.31%              4.12%

20                           4.33%              4.18%

15                           4.35%               4.22%

10                           4.36%               4.10%      


So for those of you who have a fear of stocks, this provides rather good rationale for avoiding them.  A word of caution, however, is that the FIRECalc program may be using my inputs differently than I think.
 
Re: SWR, terminal values, TIPS, I-bnds & comm pape

Excellent information, Ted, Wayne, SG, and others! My stock allocation is on the low end compared to many here (although not as low as John's ;)). This data reinforces what I'm intending to do. I'm still waiting for TIPS to bounce back to around 2.5%.
 
Re: SWR, terminal values, TIPS, I-bnds & comm pape

Ted,

Yes, your numbers are very surprising!!  - Maybe Dory can confirm the accuracy of these figures.

Got me thinking about running FIRECalc with 100% TIPS!  - I found out I don't need to be in Stocks at all and can actually increase my Standard of Living! - I am going to have to think about this seriously for a few days and then join the investment club of John Galt! :D
 
Re: SWR, terminal values, TIPS, I-bnds & comm pape

Ted -

When I read through those articles on the REHP a few months back, if my memory serves the TIPS yields used were quite a bit higher than they are today...3.4 or 3.5%?
 
Re: SWR, terminal values, TIPS, I-bnds & comm pape

I think that the intelligent way to view historical data is to understand not only what happened, but why. Future projections should not be "blind" projections of past trends, but rather should consider the "why" and try to anticipate what conditions are likely to be different in the future, and how this will be likely to cause future trends to vary from historical ones. For various reasons, I think that it is both logical and prudent to estimate that the future real rate of return on stocks will be about 2% below the historical trend.

Ha...yesterday I actually wrote a reply to this thread saying essentially the same thing...that some elements be introduced into firecalc to not only tell you when a set of circumstances would fail % wise, but to add some thinking to the periods that it failed in and the likelihood of them appearing during the draw period.

After I got done writing it and re-read it, I figured it was pointless because future predicting is no more plausible than the likelihood of calculating future returns on past data and I deleted it.

Anyhow, the point I was going to make is that in all of the cases where my results were below 100%, the percentage wasnt really the thing, it was the conditions during the years of failure. Always that 1965/66 start period. Stock market dumped, did lousy for an extended period of time, and raucous inflation. Not entirely unlike what a lot of folks here and elsewhere think we might face in the near future.

The main point is, unless your porfolio can survive such an event, 97% success rate doesnt mean much. I've looked extensively and cant find a mix at my withdrawal rate that survives that two year start period, no matter what asset allocation used. So unless you're starting with a BIG bucket, you better plan on changing asset allocations if and when such an event occurs, then switch back when its over. IF you can figure out its happening...
 
Re: SWR, terminal values, TIPS, I-bnds & comm pape

Can any of you geniuses tell me why with 100% TIPS an expense ratio of .22%, return of 2% that you get 93% SWR? :confused:

I thought that if you got a 2% TIPS and 0% in stocks you'd either be 100% safe or 100% fail :confused:

There must be something about this that I don't understand.

Cut-Throat - The willing to be enlightened.
 
Re: SWR, terminal values, TIPS, I-bnds & comm pape

A word of caution, however, is that the FIRECalc program may be using my inputs differently than I think.

Unless i'm mistaken, the results of this wont exactly be what you intended. Mostly to do with -when- the management fees are deducted rather than the rationale.

I think what you intended was to produce a rate of return lower than the program intends (how about a field in the program to enter a rate of return adjustment?) by a percentage, but view this simple calc. None of these number mean anything except as an example:

I have $100. Program adds a 9% return and produces $109. A minus 2% management fee intended to reduce me to 7% rate of return takes me to 106.82. If instead I have $100 and add a 7% increase, I get 107.

So unless I should have waited for coffee to do this, your calculations are producing result numbers slightly lower than intended.

This assumes the program applies annual gain rates to the capital, then reduces the capital by the management fee percentage. If it does it the other way around, I think that would be an incorrect way of doing it and would produce different numbers from reality.
 
Re: SWR, terminal values, TIPS, I-bnds & comm pape

Can any of you geniuses tell me why with 100% TIPS an expense ratio of .22%, return of 2% that you get 93% SWR? :confused:

I thought that if you got a 2% TIPS and 0% in stocks you'd either be 100% safe or 100% fail :confused:

There must be something about this that I don't understand.

Cut-Throat - The willing to be enlightened.

I'm going to guess. During periods of inflation TIPS bond values are increased as a taxable event annually. During periods of deflation, the values are decreased...although for the life of me i'm not sure how that would be handled in tax-land...does it count as a loss?!? Since we had some periods of deflation, that may have caused a loss of the bond value to the extent where the returns thrown off were overcome by your withdrawal rate.

Which leads me to ask if Firecalc reduces the withdrawal rate during periods of historic deflation?
 
Re: SWR, terminal values, TIPS, I-bnds & comm pape

Heres another interesting question...how come every time I go use firecalc I get logged out of the main forum and have to log back in again?
 
Re: SWR, terminal values, TIPS, I-bnds & comm pape

One limitation on TIPs that probably is not picked up by FIRECalc is that there is some volatility in their total return as the result of short-term market fluctuations, that is probably not picked up by FIRECalc. My guess is that FIRECalc assumes that the return from TIPs during any particular year would have been the interest yield plus whatever inflation occurred that year. This will work out to be correct over the life of any TIP issue, but there will be some annual deviations. During the past few years, the interest yield on TIPs has dropped and as a result the market value on TIPs that still are long-term has increased by more more than the inflation adjustment. The reverse will happen if the interest yield on TIPs goes back up. So if I wanted to depend heavily on TIPs in my retirement portfolio, I would still keep at least 25% of it in stocks (unless the planning period was less than 30 years). In fact, I have a lot more than that in stocks now, but am convincing myself of the wisdom of selling a substantial portion of them when the indicators start looking less favorable.
 
Re: SWR, terminal values, TIPS, I-bnds & comm pape

Hello Ted. Re. "unless the planning period was less than 30 years", as regulars know my planning period is
quite short. As far as "active planning" (investment
and other) I would seldom look out further than, say
5 years max. Now, the interesting part is that if I
was 40 instead of 60 (and knew what I know now)
my planning period wouldn't change much. I think it is
foolish to rely on what you hope to be doing in 10-20-30
years, for any purpose. Know how you will live if you make it, but
don't count on it.

John Galt
 
Re: SWR, terminal values, TIPS, I-bnds & comm pape

TH,

Yup, you are probably right when you included taxes in high inflation periods. Which brings up another question. Does FIRECalc assume that all funds are held in taxable accounts?  - It never ends does it ? :D

I also have had to Login each time I run FIRECalc. Firecalc probably destroys your cookies is my guess.

Anyway, If our nest egg in 8 years looks OK, I will be joining the John Galt school of investing. 100% in TIPS and 0% stocks.
 
Re: SWR, terminal values, TIPS, I-bnds & comm pape

Firecalc probably destroys your cookies is my guess.

That sounds extremely painful :-[

Funny it should do that. It doesnt seem to store any of your inputs to carry forward to future runs.

Odd.

Comment on taxes is sound. There are no provisions for taxable and nontaxable accounts, and an estimator that would identify approximate tax implications (at least at the federal level) and raise the withdrawal rate to include those would be helpful. Although I s'pose you could simply figure your own tax burden and roll that in yourself. I add 6k (~25%) to my withdrawal rates even though I shouldnt have to pay any taxes for at least another 3-5 years.
 
Re: SWR, terminal values, TIPS, I-bnds & comm pape

Wow, I never thought I'd see this. A mass epiphany that historical stock returns aren't guaranteed in the future and that an instrument with guaranteed real returns will give you a more predictable income! :)

But I have to admit, the risk mitigation voodoo of MPT is more entertaining to read.
 
Re: SWR, terminal values, TIPS, I-bnds & comm pape

Wow, I never thought I'd see this.  A mass epiphany that historical stock returns aren't guaranteed in the future and that an instrument with guaranteed real returns will give you a more predictable income!  :)

But I have to admit, the risk mitigation voodoo of MPT is more entertaining to read.

Well, it all depends on the size of your portfoilo. If I had $10 Million, I would not even think about stocks. If I only had $250K - they would be mandatory! -

I don't think any one on this forum ever said that historical stock returns were guaranteed in the future. But, if I had to guess - I'd say that the Stock market will be higher 20 years from now than it is today! Wanna place a side bet! :D
 
Re: SWR, terminal values, TIPS, I-bnds & comm pape

Well Cut-Throat, for the sake of debate I could take the exact opposite
position. With 10 million you could afford to gamble on stocks, but with only $250,000 you could not afford to take a chance. For example, with a paid off house and SS coming in, plus let's say only 5% on your $250,000, a couple
could squeak by. Now, if inflation takes off, then you
might have a problem.

John Galt
 
Re: SWR, terminal values, TIPS, I-bnds & comm pape

Before you liquidate your entire equity holdings, you might want to consider some of the following.

1) Although I have heard reasonable arguments from respectable people that equity returns might be lower than the historical average over the next 5 to 10 years, I haven't heard any credible arguments that equity returns will lag historical averages for the next 3 or 4 decades. That's how long my portfolio probably needs to survive. Such an argument is basically saying that "this time things are different". I'm skeptical of these kinds of arguments.

2) Although FIRECALC simulations that increase TIPS rates and expence ratio will result in an effective reduction in average equity returns and give TIPS an advantage, it is accomplished by reducing all equity periods. So you make the Greate Depression and all major market crashes worse than they really were in the simulation. But if equity returns of the near future are really below the historical averages, that might be accomplished by clipping the peak earning periods significantly rather than by sinking the the entire curve. I don't know how to use FIRECALC to simulate that effect, but I believe that it would have a remarkable effect on SWR and stock allocation as compared to the overall reduction approach.

3) I started this thread trying to draw attention to the importance of considering average terminal value as well as SWR. Although I mentioned how increased average terminal value could lead to increase withdrawal rates in the future, such increases also have a very important positive effect on portfolio longevity risk. Unless you know exactly when you are going to die, this should be important to you.

Using the optimum 100% safe case from Ted's simulation:
30 year
4.22% maximum safe withdrawal rate
15% stock
TIPS @ 4.5%
expense ratio = 2.25%
CPI inflation metric

This 100% safe situation results in a terminal value of 76% of the initial nest egg.

Keep all the numbers identical but increase the period to 35 years and the survival rate drops to 75.8%.

It is difficult to make a direct comparison to a more stock rich portfolio but here is an example that shows the importance of adding to the stock allocation and increasing average terminal value.

30 year
3.64% maximum safe withdrawal rate
60% stock
TIPS @ 4.5%
expense ratio = 2.25%
CPI inflation metric

This 100% safe situation results in an average terminal value of 233% of the initial nest egg.

Keep all the numbers identical but increase the period to 35 years and the survival rate shrinks slightly to 98.5%.

Clearly, the retiree looking at these two cases would need to save ~16% more money to keep initial withdrawal rate constant and move to a 60% equity position, but the fear of living five or more years flat broke would be reduced.
 
Re: SWR, terminal values, TIPS, I-bnds & comm pape

I haven't heard any credible arguments that equity returns will lag historical averages for the next 3 or 4 decades.
This is basically what it comes down to, isn't it?   We know that stocks will be volatile, but we can only hope that history will be a guide to returns.

There are several things that bother me about using history as a guide:

1) The mysterious increase in P/E ratios over the last 20 years or so.  In theory, P/E should be a predictor of dividend yields or earnings growth, but I believe it's been consistently high by something like 3% in recent history.   Hopefully Ted can set me straight on this and how it jibes with efficient markets.  In any case, watch out for a long-term reversion to the mean!

2) I suspect that the number of retail investors is at an all time high, although I don't actually know the numbers.  This can only lead to increased volatility.

3) I think we must be getting to the point of diminishing returns from an economic historical perspective, don't you?  I mean I can imagine some crazy nanotech, holographic, neural implant future, but I just don't see a repeat of the productivity gains of the last century.

Edited to add this link provided today by our hero Larry Swedroe:

http://papers.ssrn.com/sol3/delivery.cfm/delivery.cfm/SSRN_ID476981_code937.pdf?abstractid=476981

Although the probable rewards from equity investment are attractive, stocks did not and cannot offer a guaranteed superior performance over the investment horizon of most investors. Furthermore, their prospective returns are lower than many investors project, whereas their risk is higher than many investors appreciate. Investors who assume that favorable equity returns can be relied on in the long term or that stocks are safe so long as they are held for 20 years are optimists. Their optimism is irrational.
 
Re: SWR, terminal values, TIPS, I-bnds & comm pape

It is poor argument indeed to use immature and relatively illiquid equity markets as an example of what can happen in a mature market like the US. The only point that I agree with Swedroe on is that the sample size is too small. Failing a collapse in capitalistic society, I do not see a better investment than the enterprise of individuals (in the long run, and PLEASE don't quote Keynes).
 
Re: SWR, terminal values, TIPS, I-bnds & comm pape

Before you liquidate your entire equity holdings, you might want to consider some of the following.

1) I haven't heard any credible arguments that equity returns will lag historical averages for the next 3 or 4 decades.  
2) Although FIRECALC simulations that increase TIPS rates and expence ratio will result in an effective reduction in average equity returns and give TIPS an advantage, it is accomplished by reducing all equity periods.  So you make the Greate Depression and all major market crashes worse than they really were in the simulation.  But if equity returns of the near future are really below the historical averages, that might be accomplished by clipping the peak earning periods significantly rather than by sinking the the entire curve.  I don't know how to use FIRECALC to simulate that effect, but I believe that it would have a remarkable effect on SWR and stock allocation as compared to the overall reduction approach.

3) I started this thread trying to draw attention to the importance of considering average terminal value as well as SWR.  Although I mentioned how increased average terminal value could lead to increase withdrawal rates in the future, such increases also have a very important positive effect on portfolio longevity risk.  Unless you know exactly when you are going to die, this should be important to you.

I partially agree with these comments, and that is why I recommended keeping a higher percentage of equities than the 10% that gave (by a small margin) the highest SWR in my example. Specifically,

1) Argument #1 is that about 1% of the historical annual return on equities has been attributable to an increasing risk premium (P/E ratio). This can't keep increasing indefinitely, and if it simply stabilized, the effect would be to reduce equity returns by 1%. John Bogle describes this in detail in this article on the "Bogle Center" at the Vanguard site: http://www.vanguard.com/bogle_site/sp20030605.html

In addition to that, I agree with the concerns mentioned by Wabmester in item 3 of his last post. On top of the possibility that there will be no technological breakthrough to drive economic growth, there are the negative factors of an increasing, economically dependent retired population, and an increasing scarcity of easily recoverable oil.

2) This is a good point. I am optimistic that, even though equity returns will be less, there won't be any extreme crashes of the type that occurred in the 1930s. The way to handle this, and the legitimate concern expressed by SG in his item 3, is to use a very conservatively long planning period, but to allow for a withdrawal rate that has a lower probability of success -- maybe something like 80%.

Two additional factors that reduce the chances of a person completely depleting their assets are (1) the probability that they will die first (and die rich...Yee-haa!)
and (2) that their inflation-adjusted expenses in their later years will be lower than initially.
 
Back
Top Bottom