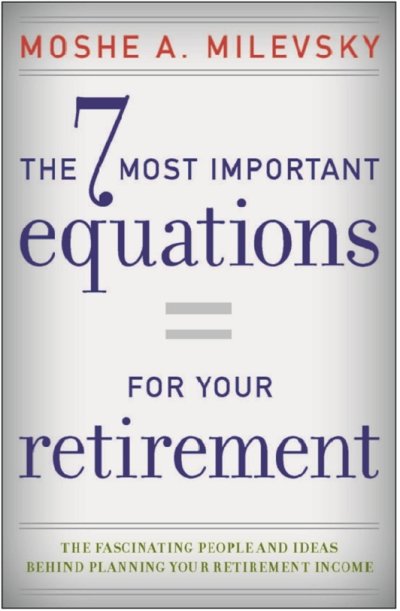
The 7 Most Important Equations for your Retirement (book)

Midpack

Give me a museum and I'll fill it. (Picasso) Give me a forum ...
Joined
Jan 21, 2008
Messages
21,321
Location
NC
Just stumbled across this book, by Moshe A Milevsky, and requested it from our local library. Did a search here, but didn't get any result. Anyone read it?

Table of Contents

Introduction: An Equation Can't Predict Your Future . . .But It Can Help You Plan for It 1

Chapter 1: How Long Will My Number Last?
Equation #1: Leonardo Fibonacci (1170–1250) 7

Chapter 2: How Long Will I Spend in Retirement?
Equation #2: Benjamin Gompertz (1779–1865) 31

Chapter 3: Is a Pension Annuity Worth It?
Equation #3: Edmond Halley (1656–1742) 53

Chapter 4: What Is a Proper Spending Rate?
Equation #4: Irving Fisher (1867–1947) 77

Chapter 5: How Much in Risky Stocks versus Safe Cash?
Equation #5: Paul Samuelson (1915–2009) 101

Chapter 6: What Is Your Financial Legacy Today?
Equation #6: Solomon S. Huebner (1882–1964) 125

Chapter 7: Is My Current Plan Sustainable?
Equation #7: Andrei N. Kolmogorov (1903–1987) 151

Conclusion: Controversies, Omissions and Concluding Thoughts 175

Appendix: Crash Course on Natural and Unnatural Logarithms 179
 

Attachments

  • image.jpg
    image.jpg
    92.2 KB · Views: 18
I have not read this, but anything that applies math from Kolmogorov should be taken seriously.

I propose that each of us put his/her retirement plan on hold, no matter if it is early or late retirement, until he/she works through these 7 equations.

Further, if one has already retired, the WR must be immediately reduced to as close to zero as possible, until the math has been worked out satisfactorily for his/her individual case.
 

indeed, if it wasn't for Kolmogrov stars wouldn't twinkle.

The Micawber equation is the most important equation in my planning. If I adhere to it every year there's no way I can fail

"Annual income twenty pounds, annual expenditure nineteen pounds nineteen and six, result happiness. Annual income twenty pounds, annual expenditure twenty pounds ought and six, result misery."

So in no year will I ever spend more than my fixed income plus the gain in my portfolio. So in years of negative return you have to really cut back or take a part time j*b. It also forces you to emphasis fixed income sources in your budget. It's a very conservative and old fashioned approach, but still worthy even if it doesn't give you any idea of what fraction of your portfolio you should actually spend. I'll have no difficulty doing it after pension and SS begin, but from ER to then my only fixed income will be rent, well that's if I don't buy a SPIA, so years where the portfolio looses will be tough. Still I have budget areas where I can economize and I can almost double the rental income and there's always w*rk I suppose.
 
Last edited:
I went to the Pfau blog on this book, where he has an article with some excellent links. The link to Milevski's work on "A Sustainable Spending Rate Without Simulation" is very informative. Here's the link:

http://qwema.ca/pdf_research/2007SEPT_SustSpending.pdf

Some of the key points I found useful were:
1. At every consumption level, the choice of investment portfolio (meaning AA) does not matter much regarding portfolio failure (he uses "ruin"). [Table 4]
The message I took away: use a more balanced AA because the additional risk isn't buying you much.

2. Using an average E-R.org retirement age of ~55 and an AA of ~50/50 (with 5% RR), the SWR ranges from 2.77-3.52%, if one wants high (90-95%) certainty of portfolio survival. [Table 5]
The message I took away: this is more conservative than many posts on this forum, and also more conservative that I had previously considered for myself.

3. There's a great formula in the conclusion section for 'back of the envelop' calcs on SWR depending on retirement age. It has you start at 3% (in the example) and add % based on forecasted longevity.
The message I took away: Start at 3% SWR and work up from there based on RE age (forecasted longevity).

Now, what this article doesn't do is account for the additional portfolio longevity gained by an adjustable WR approach; like Clyatt, et al. So, I have to figure out how that fits into my plans.
 
3. There's a great formula in the conclusion section for 'back of the envelop' calcs on SWR depending on retirement age. It has you start at 3% (in the example) and add % based on forecasted longevity.
The message I took away: Start at 3% SWR and work up from there based on RE age (forecasted longevity).

I still have to visit the links provided. Thanks for the info.

But the 3%WR caught my eye. Heck, I thought I was honky dory with 3.5%. There goes the fuel for my RV! And my booze too.

Oh wait. There's SS coming to me. And Medicare too. But can I count on it?
 
Last edited:
I went to the Pfau blog on this book, where he has an article with some excellent links. The link to Milevski's work on "A Sustainable Spending Rate Without Simulation" is very informative. Here's the link:

http://qwema.ca/pdf_research/2007SEPT_SustSpending.pdf

Some of the key points I found useful were:
1. At every consumption level, the choice of investment portfolio (meaning AA) does not matter much regarding portfolio failure (he uses "ruin"). [Table 4]
The message I took away: use a more balanced AA because the additional risk isn't buying you much.

2. Using an average E-R.org retirement age of ~55 and an AA of ~50/50 (with 5% RR), the SWR ranges from 2.77-3.52%, if one wants high (90-95%) certainty of portfolio survival. [Table 5]
The message I took away: this is more conservative than many posts on this forum, and also more conservative that I had previously considered for myself.

3. There's a great formula in the conclusion section for 'back of the envelop' calcs on SWR depending on retirement age. It has you start at 3% (in the example) and add % based on forecasted longevity.
The message I took away: Start at 3% SWR and work up from there based on RE age (forecasted longevity).

Now, what this article doesn't do is account for the additional portfolio longevity gained by an adjustable WR approach; like Clyatt, et al. So, I have to figure out how that fits into my plans.

Regarding item 3. (above).... Here's the quote from the paper "Thus, a retiree who is satisfied with average sustainability can plan to spend only 3 percent plus an additional 0.693 divided by her or his median remaining lifetime. A median of 10 more retirement years can add 6.9 percentage points to spending; a median of 20 and 30 more retirement years adds, respectively, 3.5 percentage points and 2.3 percentage points."

That would indicate that a retiree with 40 more retirement years (who is satisfied with average sustainability) can add 0.693/40 = 1.73% to the 3.0 percent for a total of 4.73%.

What is "average sustainability"?

omni
 
Most of these authors haven't lived with their equations in retirement. Their motives may be good but they have an agenda ... to prosper for some decades before retiring. One cannot do this without being carefully conservative, especially in academia. And some of those authors are either quite well off or will have pensions + book royalties.

I'm skeptical. :rolleyes::)

Idea -- if they really wanted to help, why don't they just encapsulate all of these complex notions in a software package that is offered at some very modest price (like the price of a book). They could even group together and thrash out their differences. Why should we be treated to umpteen different ideas on the correct WR methods.

Whew ... now I feel a bit better.:)
 
Last edited:
foxfirev5 said:
Spending < Income

That is the Micawber equation

The difficulty with retirement income is that it often includes the spending of principal and SWRs are always a guessing game between investment return, life span and inflation. So your equation is great, but how do you define income?

I like <=> as an elegant way to express frugality
 
Last edited:
That is the Micawber equation

The difficulty with retirement income is that it often includes the spending of principal and SWRs are always a guessing game between investment return, life span and inflation. So your equation is great, but how do you define income?

I like <=> as an elegant way to express frugality

As an old Pennsylvania German who evolved into a Redneck and then who knows what - I makes more than I spend. Its not that difficult.
I realize frugality has it's limits. As someone who is still working this may seem irrelevent but I'm trying to make a point. Do what you enjoy for as long as you want to, save like mad and the rest is a moot point.
As far as how much you can withdraw I have no idea. At least I'm honest about it.
I'll revert back to grade school when they told us never to touch the principal, or was it principle?:cool:
 
I realize frugality has it's limits. As someone who is still working this may seem irrelevent but I'm trying to make a point. Do what you enjoy for as long as you want to, save like mad and the rest is a moot point.
As far as how much you can withdraw I have no idea. At least I'm honest about it.

Spending less than your income while you are working is comparatively easy. It's when you have to generate that income from your own financial assets rather than your labor that things start to get difficult.
 
Yep, you've got it. If I had the answer I'd probably hang it up myself. Meanwhile I guess I'll hang out until the boss becomes too big of a PITA.
However I could get by on interest and divies if I had to. It's all a matter of priorites and perspective.
 
Regarding item 3. (above).... Here's the quote from the paper "Thus, a retiree who is satisfied with average sustainability can plan to spend only 3 percent plus an additional 0.693 divided by her or his median remaining lifetime. A median of 10 more retirement years can add 6.9 percentage points to spending; a median of 20 and 30 more retirement years adds, respectively, 3.5 percentage points and 2.3 percentage points."

That would indicate that a retiree with 40 more retirement years (who is satisfied with average sustainability) can add 0.693/40 = 1.73% to the 3.0 percent for a total of 4.73%.

What is "average sustainability"?

omni

My understanding of that quote is that it applies to an all-equity portfolio (7% RR). So, a balanced AA (say 50/50) would start with the longevity portion of the calculation based on a number <6.9% for 10 yrs longevity, and go down from there.

Comparing the formula's results doesn't get the resulting number to fit the SWRs in Table 5. But, they have "ruin" probabilities of only 5% and 10%. However, looking at the "ruin" %s in Table 4, it seems that "average sustainability" is a "ruin" % of ~33%, if I try to match the formula results to the table numbers.

That's just a guess at what "average sustainability" means. But, if it's correct, then no retiree would want that (33% chance of portfolio failure) as his/her goal and, thus, would use the tables in this paper versus the formula at the end.
 
all those numbers made my hair hurt.
 
all those numbers made my hair hurt.
Then, one should just use the following simple equation.

Spending < Income

But then, as one poster noted, simple as it is, that equation has great implications.
That is the Micawber equation

The difficulty with retirement income is that it often includes the spending of principal and SWRs are always a guessing game between investment return, life span and inflation. So your equation is great, but how do you define income?

Yes, it opens up another Pandora box. People who do not like to spend principal would then attempt to optimize the right side of the equation by seeking higher yields. They then are susceptible to buying high-risk assets that pay better yield now, but are likely to bring Dickensian pain and misery in the future.

I propose that there are investments that pay better than the current S&P index yield of 2.1%, and though far below the 6-7% of the high-risk aforementioned lures, still pay around 3-5% dividend for the more cautious investor.

That leaves the investor the task of minimizing the left side of the equation. Now, now, that's real work that he's faced with. I suppose that this is where the frugal posts of yesteryear, while some are obviously tongue-in-cheek, would be most helpful to our members to overcome the siren call of extraneous expenses for worldly pleasures and acquisitions that they can ill-afford.

I have not seen much of those frugal posts lately. I wonder if their frequency of appearance varies inversely with the level of the market indices.
 
NW-Bound said:
Then, one should just use the following simple equation.
Yes, it opens up another Pandora box. People who do not like to spend principal would then attempt to optimize the right side of the equation by seeking higher yields. They then are susceptible to buying high-risk assets that pay better yield now, but are likely to bring Dickensian pain and misery in the future.

I propose that there are investments that pay better than the current S&P index yield of 2.1%, and though far below the 6-7% of the high-risk aforementioned lures, still pay around 3-5% dividend for the more cautious investor.

That leaves the investor the task of minimizing the left side of the equation. Now, now, that's real work that he's faced with. I suppose that this is where the frugal posts of yesteryear, while some are obviously tongue-in-cheek, would be most helpful to our members to overcome the siren call of extraneous expenses for worldly pleasures and acquisitions that they can ill-afford.

I have not seen much of those frugal posts lately. I wonder if their frequency of appearance varies inversely with the level of the market indices.

People who seriously attempt to preserve principal are usually the carful and conservation ones that avoid higher risk investments. I think they'd attack the spending side of the equation rather than go chasing return. Of course the ultimate conservative approach of an annuity actually involves spending principal to buy a guarantee
 
So in no year will I ever spend more than my fixed income plus the gain in my portfolio.

With that plan, the real value of your portfolio will be shrinking over time. You need to add to your portfolio from current income and earnings to make up for inflation. Otherwise, after 2 or 3 decades of typical inflation, you won't have much left in real terms.

Preserving principal in real terms will be a bit more challenging than in nominal terms. But since maintaining the value in nominal terms isn't preserving the principal at all, keeping up in real terms might be a worthwhile goal, at least early on.
 
Back
Top Bottom