The fulfillment curve...

GusLevy said mostly what I wanted to say.... that the curve after "Enough" should not be going down so fast... and in NO way should it go back to the base line...

What that implies is that if you consume a LOT more than enough, you are worse off than someone who is living under a bridge going to the soup kitchen to eat.... this is NOT happening...

And I can tell you that IF I were a billionaire, that peak "enough" would be a lot higher than it is for me now.... Emeritus pointed it out that you can do a lot of things that you would not do... (for me, cars would be like paintings for others...)... I for one would be flying a lot more to many interesting destination around the world... and maybe in my own private jet.. and I can tell you that my fulfillment would not be dipping down like the graph shows...
 
I think this is a great curve. Everyone has their own "optimum".

I've overconsumed in a certain hobby, stuff got too complex, I got miserable. Pare back, simplify, get back to optimum.

I also think this curve "shifts" as you get older - older I get, the less "stuff" I want to handle, pare back to stay on the curve.

Different societies have their own curves - I think the US excels at "excessive stuff" and people make themselves miserable "swimming in crap". I sense Europeans keep consumption more trim and manageable.
 
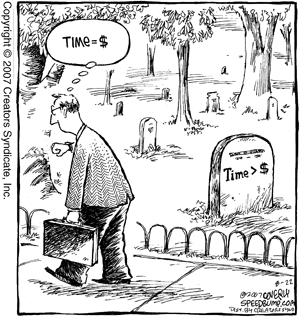
the (as far as I know) original fullfillment curve ended with a tombstone at the right hand end, signifying your limited time available.
Do you mean something like this? :whistle:
 

Attachments

  • WhyRetire.gif
    WhyRetire.gif
    60 KB · Views: 103
A problem also arises when you yourself are satisfied; however you are expected to contribute to somebody else’s "overconsumption curve".

(It's a long story :angel: )...
 
What that implies is that if you consume a LOT more than enough, you are worse off than someone who is living under a bridge going to the soup kitchen to eat.... this is NOT happening...

A good friend of mine, business owner w/ a big house, new motorhome, and many other toys, continually jokes that he would rather go live under a bridge somewhere. I know that he's only half joking.
 
Sorry Masterblaster if this curve has already been discussed in other places or even on this board. As mentioned, I am very new here and to the concept of FIRE. I thought this curve was interesting, just wanted to share it for discussion purposes.

I agree with your comment re: income and happiness.

That curve is straight out of "Your Nobey or Your Life". These type curves are discussed ad nauseum in that book.

And it's not the income that limit's your happiness. It's what you have to give up and what you have to do to get that income that limits you happiness
 
Thank you GusLevy for your post. Sorry but I am not an economist and I got lost with your sentence "Yes, the total fulfillment graph will actually turn technically parabolic at the point where the additional marginal consumption creates negative utility." Please could you kindly elaborate futher ? Thank you kindly

(Yes, the total fulfillment graph will actually turn technically parabolic at the point where the additional marginal consumption creates negative utility.)
 
http://2disbetterthan3d.files.wordpress.com/2008/02/marginal-utility.png

Greetings. I hope that the link above works as it is a graph that shows the basic story of the law of diminishing utility ("ldu"). The chart has two graphs: 1) total utility (red), and 2) marginal utility (blue). TU represents the fulfillment that is accumulated for each value spent, consumed or used. MU is simply then the graph of the first derivative of TU which equates to the marginal value added from each value spent.

The graph that you initially presented makes the mistake of confusing the concept by actually mixing both TU and MU in a sense. As TexasProud notes, it is nonsensical to have the fulfillment curve be perfectly parabolic - or even remotely so - since, in the aggregate, once we reach the point of negative MU it wouldn't take long before we figure that out and stop. So the TU curve would reach the "top" of the curve and then basically flatten out at a slight downward curve - the slight downward curve technically makes the TU curve parabolic but practically not. MU will be zero at the point where the TU curve reaches the maximum high point and goes to disutility - negative MU - from there.

....as for the other fellow's comment about using "ldu" for prostitutes or for high end art it would not apply in either situation as both are too far removed from having commodity-like attributes for the aggregate population or are too expensive or unique per unit value. Now, if the commentator meant that he uses only one prostitute rather than a new one at each occasion throughout his lifetime then this would lead to the special case in "ldu" theory where the TU curve does indeed display perfectly parabolic attributes as total fulfillment would probably reach zero given the extreme negative MU at some point.
 
Quote:
Originally Posted by MasterBlaster
That curve is straight out of "Your Nobey or Your Life". These type curves are discussed ad nauseum in that book.

And it's not the income that limit's your happiness. It's what you have to give up and what you have to do to get that income that limits you happiness


Sorry Masterblaster if this curve has already been discussed in other places or even on this board. As mentioned, I am very new here and to the concept of FIRE. I thought this curve was interesting, just wanted to share it for discussion purposes.

I agree with your comment re: income and happiness.

I must appologize for the typo. The book that discusses these (Contentment versus Money) issues is "Your Money or Your Life" by Dominguez and Robin. There is some timeless advice putting money and what you want out of life in perspective in that book, as well as some dated investment suggestions.
 
Thank you GusLevy for clarifying.

http://2disbetterthan3d.files.wordpress.com/2008/02/marginal-utility.png

Greetings. I hope that the link above works as it is a graph that shows the basic story of the law of diminishing utility ("ldu"). The chart has two graphs: 1) total utility (red), and 2) marginal utility (blue). TU represents the fulfillment that is accumulated for each value spent, consumed or used. MU is simply then the graph of the first derivative of TU which equates to the marginal value added from each value spent.

The graph that you initially presented makes the mistake of confusing the concept by actually mixing both TU and MU in a sense. As TexasProud notes, it is nonsensical to have the fulfillment curve be perfectly parabolic - or even remotely so - since, in the aggregate, once we reach the point of negative MU it wouldn't take long before we figure that out and stop. So the TU curve would reach the "top" of the curve and then basically flatten out at a slight downward curve - the slight downward curve technically makes the TU curve parabolic but practically not. MU will be zero at the point where the TU curve reaches the maximum high point and goes to disutility - negative MU - from there.

....as for the other fellow's comment about using "ldu" for prostitutes or for high end art it would not apply in either situation as both are too far removed from having commodity-like attributes for the aggregate population or are too expensive or unique per unit value. Now, if the commentator meant that he uses only one prostitute rather than a new one at each occasion throughout his lifetime then this would lead to the special case in "ldu" theory where the TU curve does indeed display perfectly parabolic attributes as total fulfillment would probably reach zero given the extreme negative MU at some point.
 
Back
Top Bottom