TIPs Fund Tracking Error

kyounge1956

Thinks s/he gets paid by the post
Joined
Sep 11, 2008
Messages
2,171
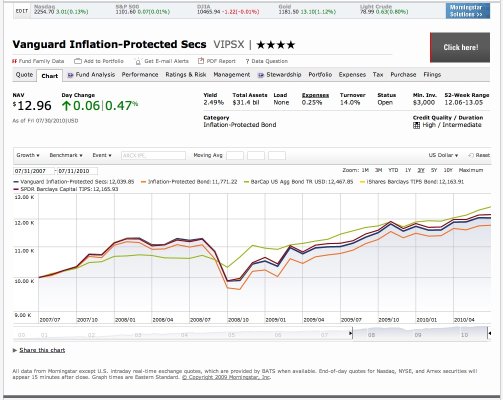
Part of my Roth IRA is in a TIPs ETF. I have recently been thinking of switching over to VIPSX, so I can automatically direct my monthly contributions into that fund—I can't set up auto-purchase of ETFs at my Roth custodian. Before doing so, I wanted to check and see whether VIPSX (which is not, strictly speaking, an index fund) tracks the index as closely as the ETF, which has matching the index as its objective. It took a while, but I eventually found an online chart (at Morningstar) which displays the index along with the fund performance. (see below—chart shows the last 3 years). It doesn't look like there is much difference between TIP (the ETF I have now), IPE (the other TIPs ETF) and VIPSX, but I was surprised to see how much all three of them differed from the index, especially how drastically they dropped along with the stock market in 2008, when the index hardly fell at all. It looks like my supposedly sober-minded bond allocation got irrationally exuberant as the bubble inflated, and then plunged along with equities (although not to as great an extent) when it popped. I thought the whole idea of having bonds in one's portfolio is that they zig when equities are zagging. Is this what people mean by "in a crash, nothing goes up except correlations"?
 

Attachments

  • TIPs fund chart.jpg
    TIPs fund chart.jpg
    216.4 KB · Views: 16
I thought the whole idea of having bonds in one's portfolio is that they zig when equities are zagging. Is this what people mean by "in a crash, nothing goes up except correlations"?
That's pretty much what it means, yes. Except in this case, there was something that went up: standard U.S. Treasuries.

TIPS, despite being a Treasury instrument, did fall pretty hard in late 2008. One of the good things that happened for me out of the crash was that I loaded up on individual TIPS with three different maturities from 2016 to 2032. All of them were priced for about a 2.9% real yield.

Seemed like a pretty good place to put some of the "safer" part of my retirement portfolio.
 
It took a while, but I eventually found an online chart (at Morningstar) which displays the index along with the fund performance. (see below—chart shows the last 3 years). It doesn't look like there is much difference between TIP (the ETF I have now), IPE (the other TIPs ETF) and VIPSX, but I was surprised to see how much all three of them differed from the index, especially how drastically they dropped along with the stock market in 2008, when the index hardly fell at all.
If you are reading the green line in the middle as the index, it's the wrong index. It's the BarCap Aggregate Bond Index, not a TIPS index. So the TIPS fund and ETFs did better than the nominal bonds in 2007 because of high inflation and fallen real yield (remember $150/barrel oil?) and worse in 2008 because of deflation and risen real yield (great opportunity to buy at that time). TIPS and nominal bonds will diverge at times. It's not tracking error because they are not supposed to track the nominal bond index.
 
TIPS, despite being a Treasury instrument, did fall pretty hard in late 2008.

Yup. Deflation, which was a big fear back when the world was ending, is bad for TIPS (especially those really old ones with a lot of accrued inflation adjustments) but great for vanilla treasuries.
 
If you are reading the green line in the middle as the index, it's the wrong index. It's the BarCap Aggregate Bond Index, not a TIPS index. So the TIPS fund and ETFs did better than the nominal bonds in 2007 because of high inflation and fallen real yield (remember $150/barrel oil?) and worse in 2008 because of deflation and risen real yield (great opportunity to buy at that time). TIPS and nominal bonds will diverge at times. It's not tracking error because they are not supposed to track the nominal bond index.

oops!:facepalm: that was the index that came up when I asked for the chart of TIP. I wonder if I can change it to the right one. Time to leave for w*rk now, but if I can figure out how to get the correct index to display, I'll re-post the chart.
 
Back
Top Bottom