I agree that there probably isn't any way to split out Wellesley's performance into separate equity and bond components, at least not based on information available on Vanguard's web site. But even without a precise breakdown it's certainly possible to make a reasonable estimate of the performance of Wellesley's bond holdings. They have a current yield of 2.7% with a duration of 6.0. That's in the same ballpark as VBIMX, so the bond component of Vanguard Wellesley almost certainly performed very similarly to VBIMX since Obgyn65 purchased his shares. Perhaps Wellesley's bonds lost a little less because of its shorter duration (6.0 vs. 6.5), but it probably wasn't a big difference.Originally Posted by obgyn65
Do you know how I can check the performance of the equity portion ? The Vanguard performance page seems to give only an overall performance for some reason.
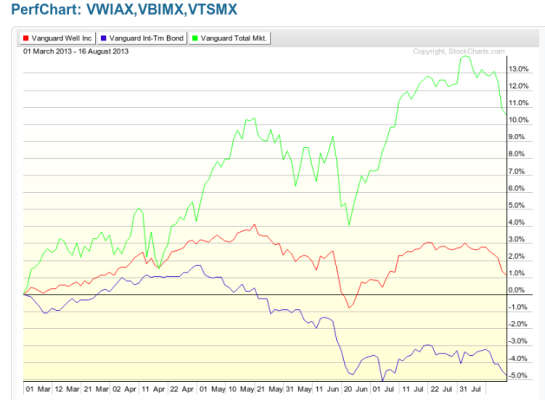
I don't think that will split out the equity portion of Wellesley which seems to be what he is asking for, since a couple of us pointed out that bond performance is what has held Wellesley down recently. And I don't know that there is a way to do that. It just seemed really obvious based on the performance of other bond funds over the same time period that this was the case for Wellesley.
What you did show was the best way to show the personal return of the OP's holding, rather than trying to extrapolate from the general performance graph of the fund.
https://personal.vanguard.com/us/funds/snapshot?FundId=0027&FundIntExt=INT#tab=2
")