Lsbcal
Give me a museum and I'll fill it. (Picasso) Give me a forum ...
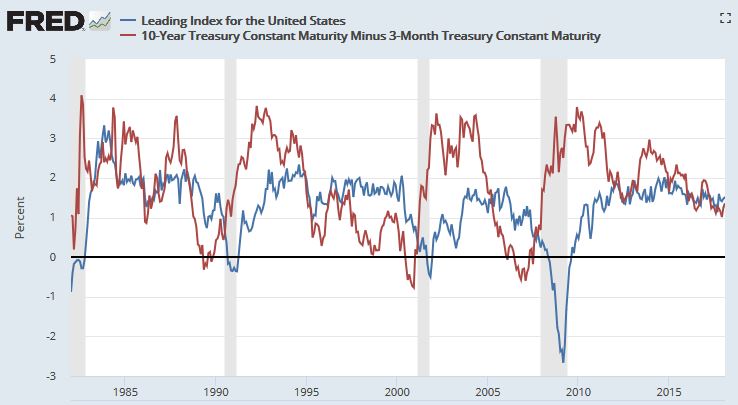
Since there is so much focus on parts of the yield curve, I thought I'd put this view out for comment. Below is a graph of the Fed's series called "US Leading Index". One component in this is the yield curve defined as the 10 year Treasury minus the 3 month Treasury.
Below is a chart showing the US Leading Index (blue) plus the yield curve (red). Notice how the US Leading Index is in positive territory consistent with a healthy economy...so far. Notice also that the yield curve could invert and the Leading Index can hold up for some months before a recession develops. Notice that the 10 year minus 3 month yield curve is pretty positive right now compared to past pre-recession periods (recessions are the shaded areas in the chart).

Here is the definition given for the US Leading Index series. This US index combines several state indexes:
My own data comparing the stock market declines in recessions versus the yield curve shows that the yield curve is one important component in signalling a bear market but not sufficient to pull the trigger. In other words, the yield curve could invert (10yr minus 3 month) but other factors like rising unemployment, high valuations (like PE10), etc. are important contributors too. So viewing yield curve inversion the day it happens (and it has not happened for the 10 year minus 3 month) is silly.
Below is a chart showing the US Leading Index (blue) plus the yield curve (red). Notice how the US Leading Index is in positive territory consistent with a healthy economy...so far. Notice also that the yield curve could invert and the Leading Index can hold up for some months before a recession develops. Notice that the 10 year minus 3 month yield curve is pretty positive right now compared to past pre-recession periods (recessions are the shaded areas in the chart).

Here is the definition given for the US Leading Index series. This US index combines several state indexes:
The leading index for each state predicts the six-month growth rate of the state's coincident index. In addition to the coincident index, the models include other variables that lead the economy: state-level housing permits (1 to 4 units), state initial unemployment insurance claims, delivery times from the Institute for Supply Management (ISM) manufacturing survey, and the interest rate spread between the 10-year Treasury bond and the 3-month Treasury bill.
My own data comparing the stock market declines in recessions versus the yield curve shows that the yield curve is one important component in signalling a bear market but not sufficient to pull the trigger. In other words, the yield curve could invert (10yr minus 3 month) but other factors like rising unemployment, high valuations (like PE10), etc. are important contributors too. So viewing yield curve inversion the day it happens (and it has not happened for the 10 year minus 3 month) is silly.
