Using Shiller PE to Time the Market

When I've tested my data base to try to do some timing based on PE10, I found the correleaitons to monthly timing very weak. Combined with some other info it does seem to have some value.
 
. . . Withdraw at a fixed SWR (say 3.5), taking that fixed percentage of the value at the end of the year, not adjusting for inflation. . . .
This, to me, is more palatable than making annual inflation adjustments. My investments don't "know" the inflation rate, why adjust my withdrawals to that rate? If my investments keep up/get ahead of inflation, then I'll automatically be taking a bit more (real) in the future. If they fall behind inflation, then my living standards will slowly decay, but at least it will be a year-by-year thing. That offers much better opportunities to make mid-course adjustments than to just keep adjusting for inflation, irrespective of investment performance, until the money is gone (or balloons to a huge amount).
 
You don't necessarily have to sit out. It's a big world out there. Find those countries with favorable CAPE, invest there.

So GC, for conversation's sake, how would you put your thesis into action?

Revealed: The world's cheapest stock markets - Telegraph

Your Money looked at the three main measures of value – the normal price-to-earnings ratio, the cyclically adjusted price-to-earnings (or Cape) ratio and the price-to-book ratio – to work out whether a stock market was cheap or expensive.

We looked at 34 countries and assessed whether they were currently trading above or below their historic average, using all three valuation metrics.

To be named “cheap”, markets had to be trading below their own historic valuation across all three measures. As the map to the left shows, only a handful of stock markets managed to achieve this feat – Greece, China, Hong Kong, India, Japan, Russia and Turkey.
THUMB.jpg
 
Your above list would be a good place to start. Practically, however, it would be difficult to buy.

As mentioned earlier, a new ETF, GVAL, seems to be a way of implementing.

My IRA custodian required me to sign some sort of waiver to buy GVAL, as they had it blocked. Still, I cannot enter orders for this online, I must call them to place a trade.
 
I have to ask myself in retirement why I'd want to buy into any of these countries (Greece, China, Hong Kong, India, Japan, Russia and Turkey) versus a broad based international ETF. I'm clearly not a bottom fisher.

For international I'd hold VEU (large cap international) and VINEX (small cap international) or VFSVX (another small cap that has recently eliminated the purchase fee).
 
Your above list would be a good place to start. Practically, however, it would be difficult to buy.

As mentioned earlier, a new ETF, GVAL, seems to be a way of implementing.

My IRA custodian required me to sign some sort of waiver to buy GVAL, as they had it blocked. Still, I cannot enter orders for this online, I must call them to place a trade.
Did they offer any reason?

Ha
 
I have to ask myself in retirement why I'd want to buy into any of these countries (Greece, China, Hong Kong, India, Japan, Russia and Turkey) versus a broad based international ETF. I'm clearly not a bottom fisher.

For international I'd hold VEU (large cap international) and VINEX (small cap international) or VFSVX (another small cap that has recently eliminated the purchase fee).
+1
The big problem with all of these in my opinion is that there is no way to get any meaningful historical statistics not to mention reasonable projections of future probabilities. No way to do a FIRECalc type measurement for example on Greece or Russia or even China. Might be some great values here but at this point in my life they are not for me.
 
I would imagine that very few of us will try to implement it. I particularly enjoy the part about if it worked, many experts would be using it, and then it wouldn't work. It is clearly not the case that a lot of money is responding to this.

What Greenblatt wrote in his "little book" stuck with me. Approaches that work only on timescales of 5+ years (sometimes even 3) tend to keep on working because most money managers get fired/hired on an annual performance basis. Even most private equity firms rarely have a horizon beyond five years.

I also recently read "Inside Job", where basically Greenblatt himself also falls prey to short term thinking. He gave money to a guy who predicted the housing bubble 3 years or so before it actually burst .. and Greenblatt wanted his money back after 2 years of underperformance (waiting for the pop). The guy forced Joel to stay.

I'm using the PE-10 as a key signal, together with inflation and a handful of others, for establishing when to move from a 50/50 allocation to a 85/15 one or vice versa. I have patience though, wouldn't mind waiting for a decade or more to move from my current allocation to the other. Minor rebalances don't have much impact so I don't bother with those.

History will tell me if that leads to the right decisions or ruined my financial future ..
 
What Greenblatt wrote in his "little book" stuck with me. Approaches that work only on timescales of 5+ years (sometimes even 3) tend to keep on working because most money managers get fired/hired on an annual performance basis. Even most private equity firms rarely have a horizon beyond five years.
This is what Jeremy Grantham refers to as career risk. The only players who have no career risk are we, the individual investors. But we often throw away this advantage. Buy and hold does take these considerations off the table.

Ha
 
Did they offer any reason?

Ha


The guy I talked to just said it was blocked, I couldn't buy. Two levels of supervisors later, when I said I'm sure I could find another custodian to accommodate my wishes on my $1mm+ IRA, he found how to get around it.

No one could give me a reason, however. Don't know whether it's because it's new or what.


Sent from my iPhone using Early Retirement Forum
This is basically good news for anyone who might be interested in taking a position in this ETF. When you try to buy it, they harass you! It does trade in low volumes, and the spreads are fairly wide and quite variable. It also is possible that it never gets the investment interest that assures its success, but I would think that if the strategy works, the volume and asset base will follow. Meb Faber is an excellent promoter.

Ha
 
I showed this a long time ago. It's a plot of the SP500 (semilog, occasionally adjusted to keep it on the graph) versus PE10 rank. The ranking is cumulative so that an earlier date does not "know" about the future. Current PE10 rank is about 90% i.e. in only 10% of time in the past was PE10 this high.

Note that there are long periods where rank is high and the market continues up. There are also bad markets with relatively reasonable PE10's like in the 1970's.

2005huc.jpg
 
Last edited:
I think this can be done but one has to be patient. I am a newbie here but i work in the bond market. The main point for Shiller PE is that all decisions have to be compared with the 10y nominal bond yield. If you take the inverse of Shiller PE currently get a yield of about 2.35% (following this article). Compare that to 10y nominal yield of about 2.43%. Stock returns are 2x more volatile than bond returns. So on a risk adjusted basis 10y nominal is a better buy (effectively on volatility adjusted scale, 10y nominal yields are like 4.97%). So in this sense, one should be overweight bonds relative to stocks right now. I think probably 75% bonds and 25% equities.

AQR (one of the best hedgefunds) has written an excellent paper on this. Particularly, read page 3, where they have presented historical returns table shiller PE range and subsequent 10y returns.

This brings me onto the topic of returns. Return by definition is currentprice/entryprice minus 1. So effectively, our "returns" have two dimensions future price and starting price. Most of us do not control the future, so what we can control is the entry price. Lower the entry price relative to earnings, the higher the expected returns . this is a given. Shiller PE provides a measure for 10y earnings relative to entry price. The lower the shiller PE, higher expected returns.

Clearly, I am a big believer in this for longterm high returns.
 
Last edited:
Current PE10 rank is about 90% i.e. in only 10% of time in the past was PE10 this high.

Note that there are long periods where rank is high and the market continues up. There are also bad markets with relatively reasonable PE10's like in the 1970's.
Thanks for posting that. Another thing I noticed is that during the 60+ year time period shown, the P/E was only below the 50%ile line for about 12 years. Those (unshown) years from 1920 to 1951 must have been characterized by some very low P/E ratios by "modern" standards.

So, the obvious question: is the whole 1920-2013 P/E "history" the one we should compare today's valuations to? Or is the earlier period less relevant (a long time ago, the market has changed, financing is more efficient, capital flows are faster, etc), and now there's a new (higher) normal for stock prices as expressed as earnings multiples? Or is the booming postwar US period the "outlier" and we should expect a reversion to the lower pre-1950 PEs?
 
Last edited:
So, the obvious question: is the whole 1920-2013 P/E "history" the one we should compare today's valuations to? Or is the earlier period less relevant (a long time ago, the market has changed, financing is more efficient, capital flows are faster, etc), and now there's a new (higher) normal for stock prices as expressed as earnings multiples? Or is the booming postwar US period the "outlier" and we should expect a reversion to the lower pre-1950 PEs?


Taking it further, i ask myself is firecalc even valid since it focuses on us data only, the most successful country in the last century. Theres no reason to assume the USA will be the most successful in the future, or that the average of global stocks will match what the US did the last hundred.

People will scoff at that. Doesn't make it wrong, or right.


Sent from my iPhone using Early Retirement Forum
 
Taking it further, i ask myself is firecalc even valid since it focuses on us data only, the most successful country in the last century. Theres no reason to assume the USA will be the most successful in the future, or that the average of global stocks will match what the US did the last hundred.

People will scoff at that. Doesn't make it wrong, or right.
Doesn't matter. There's an asteroid out there with our name on it...
 
Doesn't matter. There's an asteroid out there with our name on it...


I don't think thats exactly the same thing, not even probabilistically.


Sent from my iPhone using Early Retirement Forum
 
Taking it further, i ask myself is firecalc even valid since it focuses on us data only, the most successful country in the last century. Theres no reason to assume the USA will be the most successful in the future, or that the average of global stocks will match what the US did the last hundred.

People will scoff at that. Doesn't make it wrong, or right.


Sent from my iPhone using Early Retirement Forum


The US might not be the most successful country if measured by stock returns... but I think that it will be a huge force in the world economy as long as you and I are alive....

We are so much larger than a lot of other countries... it would take many many years of decline on our part added to unbelievable gains on theirs... this might happen over a couple of hundred years.... but not the next 30 to 50...

Of course an asteroid can come crashing down in the middle of the country and speed up the decline... but I am not going to worry about that one...
 
Here's an interesting chart on the US economy relative to other countries. The total area for each slice represents the country's GDP. The U.S. is indeed the world's largest economy on both an aggregate and per capita basis, with China following as second largest in aggregate.

Hard to say if it proves or disproves Texas Proud's hypothesis...

The World Bank summed up the entire global economy in one chart - Vox
imfchart.png
 
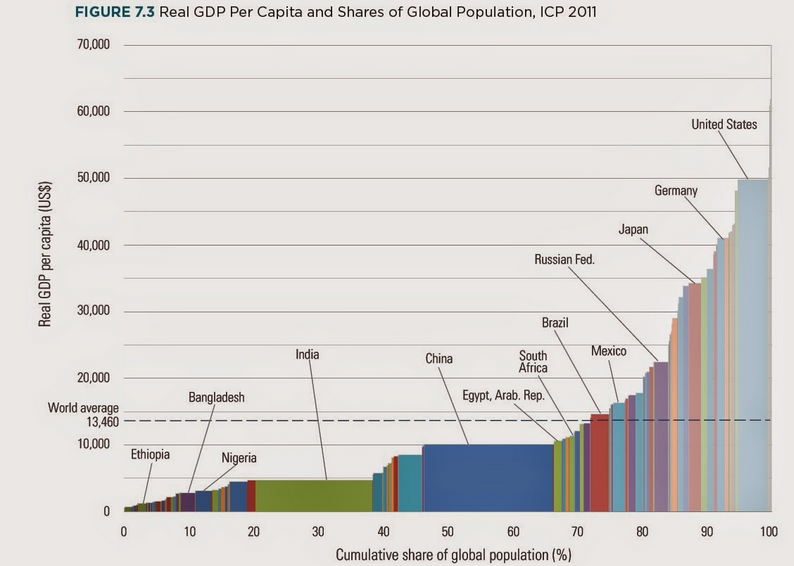
That is per capita... here is total.. China will pass us by in total sometime, but I do not think they will come close to per capita...

Also,

Gross domestic product 2013
(millions of
Ranking
Economy
US dollars)
1
United States
16,800,000
2
China
9,240,270
3
Japan
4,901,530
4
Germany
3,634,823
5
France
2,734,949
6
United Kingdom
2,522,261
7
Brazil
2,245,673
8
Russian Federation
2,096,777
9
Italy
2,071,307
10
India
1,876,797
11
Canada
1,825,096
12
Australia
1,560,597
13
Spain
1,358,263
14
Korea, Rep.
1,304,554
15
Mexico
1,260,915
16
Indonesia
868,346
17
Turkey
820,207
18
Netherlands
800,173
19
Saudi Arabia
745,273
20
Switzerland
650,782
21
Argentina
611,755
22
Sweden
557,938
23
Nigeria
522,638
24
Poland
517,543
25
Norway
512,580
California would rank 10th

Texas would rank 16th
 
A couple of books I have read recently which get to the heart of the question of the American decline, "The Upside of Down" Charles Kenny talks about why the rise of the rest of the world does not equate to any required fall in the growth or standard of living in t he U.S. As an example look at the standard of living for the masses in the U.K. now vs. when they were masters of the world.

Another is Kurtzman's "Unleashing the Second American Century." His four points of why America will likely remain on top: 1) Soaring levels of creativity, 2) Massive new energy reserves, 3) Gigantic amounts of capital, 4) Unrivaled manufacturing depth.

Lots more in both of those books, good reads that I would recommend.

Since the beginning of the republic there have been predictions of America's eminent decline. My bet is that there is still a lot of life left in the old gal, it is not even certain that we have seen the best yet. And given the degree of risk in investing elsewhere, investing in the U.S. still seems to be a pretty good bet to me.

And as Texas Proud points out, worst case, our size and inertia should keep things going for the next few decades at least.
 
I would use the PE10 to decide where in the world to invest, as a comparison, but there is not accurate publicly available data on companies outside the US, thus making it very difficult to come up with PE10 numbers. Even if you look at websites like Yahoo and Morningstar, you get different numbers when look at such data on different countries. Plus there is some strange calculations by some data providers in which negative earnings are treated as positive earnings, which really skews the results.
 
For your reference, CAPE Ratio this website provides shiller PE for individual US stocks and the newsletter gives list of best 25 stocks, as in with the lowest Shiller PE.
 
Back
Top Bottom