An oddball idea?

The problem that causes almost all failures is a prolonged (3-5 year) down market shortly after retirement.  Eating into the principal so much during that prolonged period just doesn't leave enough to recover.

Randomizing the selection of years would make meaningless the one primary cause of failure -- sequential years with down markets, occuring shortly after retirement.
 
Well, 2007 is not going to be independent of 2006, and July is not going to be independent of June. If we tried to model what was going to happen in 2007 or in July, and we abandoned the conditions leading up to those times, we might be able to claim "independence" but we won't learn more -- we'll have shuffled the data and pretended to get more data points by using them in a different order, but by doing so, we will have given up what made the data meaningful in the first place.

To some extent, my point above is musing. I don't know what this technique expands the quantity of available market-like data. Let's get that preface out first.

But your last phrase, Dory, is suspect. We do not know what makes that data meaningful (or even if it is meaningful, I suppose, but we presume that it is for all the discussion). I alluded to this above. The definition of "market-like" is not determined.

In fact, there would seem to be a tendency to look at the numbers as entities in and of themselves, when they are not. They are a measure of human behavior. They are the correlation coefficients of weather in that Wisconsin county that just happens to sync up to the moons of Jupiter -- i.e., a raw measurement absent an explaining algorithm.

So, not to be argumentative, but there is no algorithmic reason to, say, not prefer a definition of "market-like" to be how often over 130 yrs there were gains of 0-5%, 5-10%, 10-15%, etc. histographically vs in what order the numbers occur. Maybe humans behave a certain way more often than other ways and they do so more reliably than they behave in certain ways sequentially.

I don't claim that the histogram is the definition of market-like. I don't know, any more than I knew above ahead of time if a particular spectrograph of the waverform might describe market-like. I'm just pointing out that we don't know what makes that waveform market-like, and it could be something other than the order of the numbers.

The problem that causes almost all failures is a prolonged (3-5 year) down market shortly after retirement. Eating into the principal so much during that prolonged period just doesn't leave enough to recover.

Randomizing the selection of years would make meaningless the one primary cause of failure -- sequential years with down markets, occuring shortly after retirement.

. . . and that is a significant truth in the discussion.

Like I said, I don't know exactly what this means or how to expand it. I'm puzzled by this item, Dory, in that MC runs yield lower SWRs, yet you're saying randomizing the data will result in more frequent success. Hmmm. I know both are true, but what does this mean algorithmically for the mechanism that causes all this to happen?
 
I didn't say that randomizing the data would increase the rate of success -- I was saying it would remove the one thing that we do know about the data, and that is that it really happened.
 
For those concerned about the independence issue, consider this.

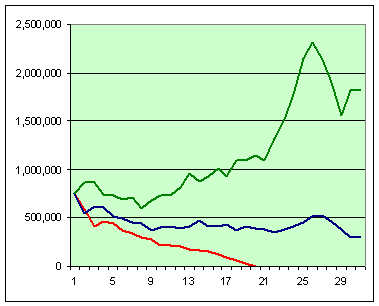
A 30 year retiree in 1973, another in 1974, and a third in 1975 experienced exactly the same conditions for 28 years of their retirement -- the years 1975 - 2003 were shared years.

It's tempting to say that this overlap makes any results too similar to be meaningful as separate instances. But that simply isn't the case, since it is, as I have said, the initial few years that have such big impact. And every single starting year is a separate and distinct situation, as the graph below shows.

This graph is the year-to-year portfolio balances after taking $35,000 (and adjusting for inflation) from a $750,000 portfolio every year for 30 years, starting in 1973 (red line), 1974 (blue line), or 1975 (green line).

73-75.gif


This makes it pretty clear that the first year or two overwhelmingly sets the stage for the future, far more than the 28 years that all three retirements had in common.
 
Amen

Sure glad I was a really, really cheap bastard the first 12 yrs(1993 -2005).

Gotta just love those dryer sheets!

heh heh heh heh heh heh heh heh
 
You can do this two ways: in the weeds like firecalc or prarie dogging it with long term rates of return-average inflation-taxes. Not surprisingly, you end up in the same place. Only two things that screw you up are, as shown above, a sharp downturn right after you retire or a long crappy period like 1929- and 1964-.

Since you cant predict either, or even put odds on it, I think you take your best shot and a reasonable withdrawal you're comfortable with and if you run into a wall right away, have a backup plan. If you run into a long crappy period, have a plan for that but know that everyone else is also having a tough time and its all relative.
 
Cute n Fuzzy Bun'ny said:
... If you run into a long crappy period, have a plan for that but know that everyone else is also having a tough time and its all relative.
My plan is to move in with relatives. :D
 
Careful, they might wanna move in with you!

Have a fast escape boat with plenty of y2k provisions stored and a couple of doubloons sewed into the seats...
 
Excellent. Just an excellent graph. And I think you are saying that's without Social Security. Good data.

Okay, here's the thing. The presentation of information is with a single SWR number PLUS a statement of % of times a given SWR is successful. If you constrain all conversation to only the first item, the SWR number, then you can say "this is history. This is what happened. There was one occasion a given SWR failed and thus you may not go beyond that without losing total historical confidence of survival."

But the moment one says 99% of cases succeeded, or 95% of cases succeeded -- that very moment one moves into the realm of statistics. Once one does that all issues associated with statistics are put into play. This includes independence of "samples", of course, and perhaps the most prominent of all statistical issues is sample size.

Dory, you noted, and this is powerful, that moving past that magical SWR number that yields a single failure suddenly yields a great many more failures as well. The sensitivity of this undefined algorithm seems to be extremely sensitive to increases. That tends to undercut the importance of the statistical issues -- because it suggests that the sensitivity is so high that increased sample sizes won't change the conclusion.

The problem is one doesn't know why. Why is the number 4 rather than 6, or 2? What is the control feedback you lightly suggested way up higher in the thread that constitutes the algorithm.

It's a good discussion. Might learn something. Oh, and one more thing. Shuffling the array of 130 yrs of human behavior measures does not preclude the creation/existance of long, downward periods. Random distribution of those array elements will, now and then, create such multi year down periods. Hell, after 1000 such shuffles and recomputations, averaged together, maybe the results don't change. Now that would be positively scary.
 
You pose some interesting questions that I would have no idea how to attempt to answer. But any contribution you can make from analysis of the data would be welcome.

The best single source of long term data is from Yale prof Robert Shiller's research for his book Irrational Exuberance, available online at http://www.econ.yale.edu/~shiller/data/ie_data.htm. It contains monthly snapshots since 1871.
 
Thanks for the reply with the data source. I'm not retired, but I do find myself on some 20+ hour trips to Singapore now and then (Do you realize Singapore is flying the absolute newest and most effective fighter aircraft in the world?) and way too often the movie selection is lame.

Business class has laptop rechargers and the whole situation cries out as being a "rainy day" and therefore a good moment for rainy day projects. I'll play around.

Is there more than just S&P data on this Schiller site?
 
I will state - without a lick of proof - it's 4% cause the Norwegian wider says so.

Unfortunately applying current yield of a given portfolio over long periods of time - leaves lots of room for debate.

Save the Bogle method for later.

To paraphrase that great financial guru Yogi Berra - dividends are almost as good as real money.

But that's just me.

heh heh heh heh heh - and I plan to cheat: take 5% variable for a few years - before I get too old.
 
Uncle Mick I'm finding I'm favoring that Norwegian wider method, at about 3.75%

I got a very good feel for the numbers using FireCalc, and then decided to do it my own way. Using the divs/interest from my taxable account, I have what I need. The IRAs, future SS, and my parents' trust :D can take care of any surprises. More than anything else, I want simplicity and hands off and spending my time on other things.
 
kate said:
I got a very good feel for the numbers using FireCalc, and then decided to do it my own way.   Using the divs/interest from my taxable account, I have what I need.  The IRAs, future SS, and my parents' trust :D can take care of any surprises.   More than anything else, I want simplicity and hands off and spending my time on other things.

What, you think you're retired or something!?! :LOL:
 
Back
Top Bottom