Do you use the FireCalc default values for these?

Carpediem

Full time employment: Posting here.
Joined
Aug 26, 2016
Messages
770
Just wanna make sure I'm using FireCalc correctly. Do you use the default values for:

- Your Portfolio tab / Total Market - default date is 1871. Do you change it?

- Investigate tab / Success rate - default is 1960. Do you change it?
 
I use those defaults. Just change the stock allocation % and the ER fee %.
 
I changed almost everything just so I could better understand the program. I really like the Bernicke spending model. I think the model is a little too simplistic but I do believe you spend more in the early years and less as you age. Though the model did not reflect my theory that there is a likely significant uptick in the very later years.
 
I changed almost everything just so I could better understand the program. I really like the Bernicke spending model. I think the model is a little too simplistic but I do believe you spend more in the early years and less as you age. Though the model did not reflect my theory that there is a likely significant uptick in the very later years.

Yeah that's my issue with the Bernicke model too, plus it is very optimistic for the max spending yearly.
Rather go with the more conservative results, but not take any further haircuts.
 
There are two things I change:

1. I set inflation to 0% because I believe I can minimize the effects by making different choices. I also do not include SS benefits or their annual COL increases so that's my hedge. Sometimes I will go back and see what happens if I put in 2% or 2.5% annual. But then I'll add SS and it more than offsets any difference.

2. I set the total market date to 1938 (after the Great Depression). Again, I think if we ever see conditions that harsh I can make drastic adjustments.

An afterthought - I think it would be useful if there were a way to have FireCalc reduce spending by a certain percentage during the years of poor returns as most of us would likely due, rather than assume a somewhat static withdrawal amount regardless of economic conditions.
 
Last edited:
I change a bunch of things. If you want to scare yourself:


Try consistent growth of 4% and inflation rate of 3%

Shave the SS 25%

Figure 70% of portfolio taxed at 12%

I do all sorts of manipulating to see worse case scenarios.
 
I use those defaults. Just change the stock allocation % and the ER fee %.

Those ones are the key ones for me plus choose ST treasury vs Long term interest since that reflects our portfolio the best.

I use the investigate tab spending level to understand the max we can sustain and the leave some money in estate option to also pressure test.

One thing I have done that I think someone suggested on this forum is to test for “an even worst case” sequence of returns. What I do is to first change the number of years of retirement to something short - i use ten years. And then take the worst case portfolio balance RESULT of that worst 10 years sequence and run a new scenario for the remaining 25 years of planned retirement to see (and the worst sequence of returns AGAIN) and see what our chance of surviving is.

For example for us we have 100% for 35 years @ expected spending rate with a good buffer. With the worst 10 years our portfolio is down about 1/2 followed by the worst 25 years we survive only 92% of the time. Still pretty good assuming this is really worst case - I SURE hope so.
Good one. I'll try those scenarios.
 
For the items the OP listed, I use the defaults in my base case run, which I consider the most likely outcome based on my actual current data. (I do change a lot of the other defaults to represent my particular situation.)

After I do that, I also go into the Investigate tab and see what spending level I would need to increase to in order to reduce my success rate to 95%. This tells me how much I think I could reasonably spend, as personally I think the future will be slightly better than the past.

Using that spending level, I then run it a third time looking at the asset allocation to stocks and see how that affects things. This tells me if I need to change my target AA. (Usually I aim for the highest stock allocation that is consistent with a 95% success rate, which is usually 90%.)
 
Last edited:
For the items the OP listed, I use the defaults in my base case run, which I consider the most likely outcome based on my actual current data.

After I do that, I also go into the Investigate tab and see what spending level I would need to increase to in order to reduce my success rate to 95%. This tells me how much I think I could reasonably spend, as personally I think the future will be slightly better than the past.

Using that spending level, I then run it a third time looking at the asset allocation to stocks and see how that affects things. This tells me if I need to change my target AA. (Usually I aim for the highest stock allocation that is consistent with a 95% success rate, which is usually 90%.)

Bolded by me - Interesting. Many folks could go the other way i.e. what is the least exposure to stocks I need for a 95% success rate.
 
Bolded by me - Interesting. Many folks could go the other way i.e. what is the least exposure to stocks I need for a 95% success rate.

That is the way I look at it. Firecalc tells me I can go to 0% equites and still be on target for 100% success. I have more than that in equities, but still why would you want more risk?
 
Some of these replies are very confusing. It would help to explicitly state whether you are using FIRECalc as most do, with the default of a historical report, or are you using the "consistent growth of %, and an inflation rate of %" or "portfolio with random performance", option?

Big, big difference. IMO, the historical is useful, the other two are maybe only 'interesting' - to some (not me).

Originally Posted by jabbahop View Post
....
One thing I have done that I think someone suggested on this forum is to test for “an even worst case” sequence of returns. What I do is to first change the number of years of retirement to something short - i use ten years. And then take the worst case portfolio balance RESULT of that worst 10 years sequence and run a new scenario for the remaining 25 years of planned retirement to see (and the worst sequence of returns AGAIN) and see what our chance of surviving is.
Good one. I'll try those scenarios.

I change a bunch of things. If you want to scare yourself:


Try consistent growth of 4% and inflation rate of 3%

Shave the SS 25%

Figure 70% of portfolio taxed at 12%

I do all sorts of manipulating to see worse case scenarios.

Rianne, your two statements are at odds with each other. If you are setting consistent growth/inflation rates, then the 10 year and 25 year sequences that jabbahop mentions don't apply. There is no difference in splitting them up.

IMO, stringing the two sequences is really extreme - you get hit with the worst ever ten years apart. It just seems beyond anything realistic. Those worst case drops come after a run-up (bubble of sorts). If you are still down, another down period like that is just extremely far from likely.

However, there is value in that 10 year run (or a 5 year run). People often focus on the end result, and those mid years get crowded on the graph. But people should be aware that even with a conservative WR, a successful portfolio can take a deep dive in the first 5-10 years. And it succeeds even w/o cutting spending.

And you can play with that, and find that the oft-heard comment around here that "if my portfolio tanks, of course I'll just cut back some", really does very little, even with extreme cuts, done early (before you even know you are in deep trouble), and can last a long time before they have much effect.

To provide some perspective - if you have a conservative 3% WR, and your portfolio tanks 40%, a 1.5% drop in WR is a pretty minor thing. But unless you have a lot of discretionary budget, cutting half your spending will be painful. Heck, even with a large discretionary budget, cutting half your spending will be painful. You must be having fun with that budget, who wants to cut back in the early years, when we are best able to enjoy it? If you like to travel, or hike/camp, etc, that may not be so much fun in your later years.

I have an old thread on this, something about "scary dips" in the title?

-ERD50
 
Last edited:
I usually put in spending (excluding mortgage payment), portfolio value and years = (100- current age), input SS, fixed pension, annual fixed mortgage payment as off-chart spending and offsetting fixed pension when the mortgage is over, change stock % from 75% to 60% and that's it. Sometimes I'll also put in 75% of SS to see the impact of any potential SS reduction.
 
Last edited:
Bolded by me - Interesting. Many folks could go the other way i.e. what is the least exposure to stocks I need for a 95% success rate.

That is the way I look at it. Firecalc tells me I can go to 0% equites and still be on target for 100% success. I have more than that in equities, but still why would you want more risk?

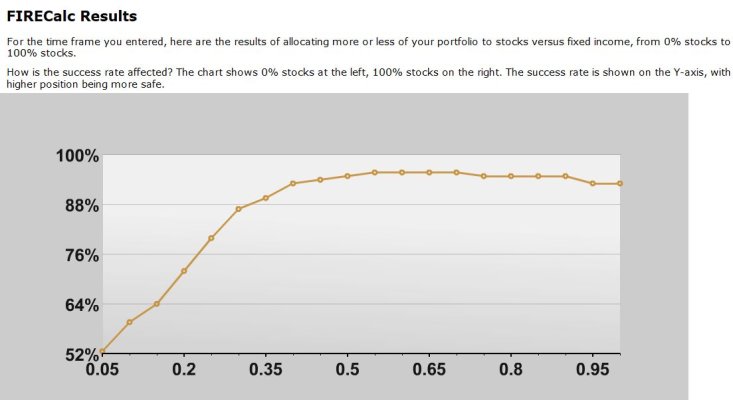
When I ran the numbers this morning after my previous post on this thread, the success rate across various AA's was essentially the same (between 90% and 95%) from about 35% stock to about 90% stock IIRC. It tailed off a little bit at the high end (maybe 85% at 100% stocks), and dropped off quite a bit at the low end (maybe 30% at 0% stocks).

I don't view it as taking on more risk - the historical success rate in that middle plateau area is, as noted in the previous paragraph, essentially the same - it's 90% to 95%. The historical success rate across my duration - not portfolio volatility - is what I view as my primary measure of risk. So for example I view being 0% equities and having a 30% historical success rate as riskier than having a 100% equity allocation and having an 85% historical success rate.

The reason for preferring the higher end of the AA plateau is that, if one can stomach the associated volatility, the ending portfolio values are quite a bit higher, and the possible options for increasing spending later is quite a bit greater. Although I've been having trouble blowing my dough, the idea of increasing my spending over time has always appealed to me.

I have an already quite low ~1.5% net WR plus a number of other belts and suspenders and staples backup contingency plans, and I am an extreme and persistent optimist about the future of this country. As a result of those two things, I don't worry about the downside and want to participate in the upside. I also have three kids who will inherit whatever is leftover when I shuffle off this mortal coil, and so I'm inclined to invest for them inheriting, hopefully 30 or 40 years in the future.

I do understand the strategy of de-risking when you have enough. It's a strategy that many on this board use. I have used it on the subset of my assets related to my kids' college costs. I think it makes a lot of sense given certain circumstances - those circumstances apply to my kids' college but not my overall retirement.
 
When I ran the numbers this morning after my previous post on this thread, the success rate across various AA's was essentially the same (between 90% and 95%) from about 35% stock to about 90% stock IIRC. It tailed off a little bit at the high end (maybe 85% at 100% stocks), and dropped off quite a bit at the low end (maybe 30% at 0% stocks).

Yes. It would graph out to look like this:
 

Attachments

  • Equity % success rates.JPG
    Equity % success rates.JPG
    65.2 KB · Views: 21
Yes. It would graph out to look like this:

Right, that's roughly what mine looks like, although I think it does vary a little depending on inputs - duration in particular. I run mine for 40 years because I am 49 years old currently and am [-]naive[/-]optimistic that it will be the other guy who dies early.
 
Back
Top Bottom