I Thought 4% Was A Good Target, but FIRECALC Doesn't?

L

Lovely Rita

Guest
I've run FIRECALC several times with my proposed plan, but it does not look very optimistic.
____________________________________
"Your plan is to spend $30,000 a year, or 4.00% of your starting portfolio.

FIRECalc looked at the 106 possible 30 year periods in the available data, starting with a portfolio of $750,000 and taking out $30,000 the first year of your retirement, and the same amount after adjustments for inflation each year thereafter.

(FIRECalc assumed your retirement portfolio is in investments that perform about like the US stock market as a whole. Mutual funds report each year how well they have performed relative to the stock market as a whole. Such information can help you see how relevant this information might be to your situation.)
The key result: a 78.3% Success Rate"

_____________________________________

I have been aiming to hit three quarters of a million dollars in my nest egg, only because I need 30K a year from it, and "everybody sez" 4% is a reasonable SWR.

This will all be in all in a tax-deferred account, made of mutual funds and fixed investments with a 50/50 ratio. The expenses run less than 1% annually.

So why is FIRECALC sooo pessimistic? I am gonna cry. It will take me 3 more years of work to achieve what I THOUGHT would be the goal of $750K, but I need more assurance than 78% chance of success. :confused: I am so conservative, I am not even counting SS, but it looks like FC is even more conservative than me.

:'(
 
Check your allocations. At the default 75-25, you'll see 94+%.
Or try the advanced option and try different allocations --
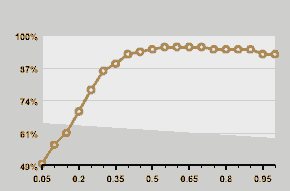
note below how an increase in allocation to stocks rapidly gets your success rate way up there... the proportion allocated to stocks is read across the bottom, the success rate is on the vertical axis.
 

Attachments

  • alloc.gif
    alloc.gif
    2 KB · Views: 66
  • alloc.gif_thumb
    9.6 KB · Views: 1
Dory,

I was glad to see this post. I've been somewhat amazed at how folks seem to assume that their investments will "do as well as the market as a whole." I don't think that is really a slam dunk assumption. Rita's requirement of wanting the low volatility of a 50-50 allocation but still having a 4% SWR is a good example.

Also, many folks are now being influenced by a recent, popular book to increase cash allocations into the 25% range to protect them from having to sell equities in a down market. But, they don't give consideration to the overall impact on their portfolio's growth this will have.
 
Lovely Rita said:
So why is FIRECALC sooo pessimistic? I am gonna cry. It will take me 3 more years of work to achieve what I THOUGHT would be the goal of $750K, but I need more assurance than 78% chance of success. :confused: I am so conservative, I am not even counting SS, but it looks like FC is even more conservative than me.
Don't cry, be happy that you have a conservative calculator to keep you honest. As others said a more aggressive portfolio may make sense. But, more importantly, why ignore SS. It may be modified in the future but it won't just disappear. A likely cutback will be through means testing but it doesn't sound like you will hit any likely thresholds.

Run Firecalc with a more agressive mix and no SS, then run it with an estimate for SS that is a little below what current trends predict.
 
donheff said:
Run Firecalc with a more agressive mix and no SS, then run it with an estimate for SS that is a little below what current trends predict.

Yes, I think it's a good idea to "de-rate" SS a bit (I do so by 25% or so) but I
think it's really paranoid to think it won't be there - probably a lot of that is
scaremongering by you-know-who (hint: he wants to "privatize" SS).

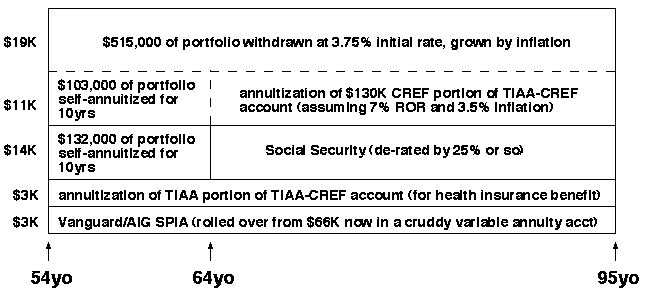
What I do is set aside enough money to buy a "period certain" annuity which makes
up SS from when I plan to retire until I start SS (probably best NOT to start at 62yo,
but that's a whole 'nother topic). Can price the annuiies at:

http://www.aigretirementgold.com/vlip/VLIPController?page=Overview

Not necessarily advocating you purchase the annuity, but it provides a good data
point of how much money you need for "pre SS" with pretty conservative ROR
assumptions.

Then use FIRECalc to figure out if what's left over in your nestegg (after pulling out
these pre-SS funds) can supply your income needs in addition to SS.

Of course, this is built into FIRECalc's estimates if you tell it about SS, but I prefer
to do it this way because it keeps it clear in my head how I'm actually gonna come
up with my income. I like to use these little drawings I came up with too.
 

Attachments

  • plan_payout.png
    plan_payout.png
    4 KB · Views: 30
  • plan_payout.png_thumb
    11 KB · Views: 2
I use our age 62 Social Security amounts with FIRECalc. That way, if there's a reduction in SS benefits, we can postpone collecting SS to 63 or even later to compensate (sort of).
 
So is the real SWR a bit lower than 4%? Not too many folks are gutsy enough to hold 75% stock or more retired. That's a pretty strong weighting to stock even working.

Stocks are great investments, but past performance is no guarantee of future returns. 75%+ would indeed be the proverbial putting all your eggs in one basket.
 
The real SWR is 4%; and has as a base assumption a diversifed equity allocation (S&P) and a bond allocation (I think 5 yr bonds). Too much equity or too much fixed is a bad thing, but the right mix is about 75% equity and 25% fixed.

fixed/equity allocation at 4% WD

100/0 success: 25.3%
75/25 success: 52.0%
50/50 success: 86.7%
25/75 success: 92.0%
0/100 success: 86.7%

Data on more diversification above the S&P shows higher success rates than above with the WD rate at 4%.

fixed/S&P/sm val/sm gwt/lrg val/ lrg gwt allocation at 4% WD

25/25/12.5/12.5/12.5/12.5 success: 93.3%

If I had data on international, commodities and REITs I think there would be another increase in success rates.

The basis for the 4% is to hold about 75/25 equity/fixed and the equities must look like the S&P.

job
 
I entered the folllowing into advanced FireCalc and came up with 100% success:

Total Portfolio: $750K
1st Year Withdraw: $30K
SSI: zero
Years: 30
Inflation CPI 3%
Expense Ratio 0.18%
Invested as follows:
25% S&P
25% Large Value
50% 1 month treasury

In this case a very conservative investment allocation comes out shining.
 
My data set is different, but when I run the above in my calc, the success from 30 to 40 year simulation is drastic. Having such a large fixed component is more susceptible to the raves of inflation.

job
 
Daddy O said:
The real SWR is 4%; and has as a base assumption a diversifed equity allocation (S&P) and a bond allocation (I think 5 yr bonds). Too much equity or too much fixed is a bad thing, but the right mix is about 75% equity and 25% fixed.

Maybe 1 in 5 financial advisors would endorse 75% or more to stock for a retired individual, but that's probably a bit too optimistic.

Want to do something really risky? Retire at a very early age, AND load up on stock. You guys doing this have more guts than me and other highly respected individuals like Scott Burns.

.........

As an aside, but somewhat related, most of the popular market timing strategies are based off of successful "backtesting". When you have 100% hindsight, you can devise some incredible timing schemes. I presume the 75/25 was derived similarily. If only the future repeated what the past did, we should all be market timers and loading up on 75% stock after retiring.
 
dory36 said:
Or try the advanced option and try different allocations --
note below how an increase in allocation to stocks rapidly gets your success rate way up there... the proportion allocated to stocks is read across the bottom, the success rate is on the vertical axis.

Dory,

My reading of that graph is that the success rate doesn't improve when you allocate more than 55% to equities. That agrees with my research that something around 60/40 is the sweet spot.
 
Everybit of reading Ive done on the subject would put me in the range of 50-60% myself, and probably the bulk of my stock holdings would be in large caps;..... if i were retired.
 
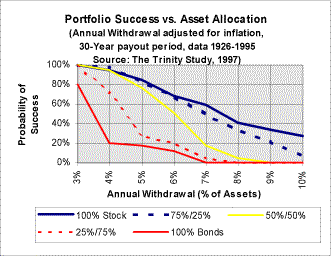
Here's the allocation vs success rate from the Trinity Study:

trinity3.gif
 
wab said:
Here's the allocation vs success rate from the Trinity Study
Hmmm... that would seem to endorse a high-equity portfolio.

Edited to reflect that I didn't read the graph correctly. Never mind.
 
wab said:
Here's the allocation vs success rate from the Trinity Study:

trinity3.gif

So at 4% SWR, 50/50 and 100% stock are more or less the same chance for success.

Yo JG, take a gander at that 100% bond line. hehe
 
Also note it is for a 30 year horizon. As stated before, I believe the high fixed allocations will fare much less favorably versus the higher equity allocations over a longer period. Did the Trinity study publish 40 year + horizons?

I'm not sure 75/25 is the perfect allocation if there is such a thing. I don't slice my simulations that thinly. Maybe it is 60/40 if it exist. I think it is very dependant on how rebalancing is done and the particular withdrawl strategy. If I find it you'll be the 2nd thru 2000'th to here it first.

job
 
REWahoo! said:
Looks to me like 50-50 works pretty well.
Uhm, you're absolutely right. I withdraw my earlier snarky comment and I apologize for it.

I expected to see an x-axis of lifespan and so that's exactly what I saw. When I went back and looked again ("50-50?!? WTF is he talking about?!?") I realized my mistake. Thanks for the nudge...
 
Daddy O said:
My data set is different, but when I run the above in my calc, the success from 30 to 40 year simulation is drastic. Having such a large fixed component is more susceptible to the raves of inflation.

job

Not sure what you mean by "different data set" or "drastic" but when I run the same numbers for 40 years the success rate drops from 100% to 94.6%.
 
Daddy O said:
Also note it is for a 30 year horizon. As stated before, I believe the high fixed allocations will fare much less favorably versus the higher equity allocations over a longer period. Did the Trinity study publish 40 year + horizons?

I think the opposite; the longer you have to be almost pure stock as a retiree, the greater the chance you're going to see a repeat of the 1930s. Good luck!

Azanon
 
Back
Top Bottom