Is it legit to re-run when market rises?

I find it amazing when posters understand the same thing, but choose to disagree simply because they use different wording to express it. It is then no surprise when wars happen if they actually disagree.

About portfolio present value, yes, one should go beyond the "100%" result by FIRECalc and look at the chart to see how low it can be with a WR of 4%.

In real life, FIRECalc or not, if the present value gets anywhere near 50% of its starting point, people will start shaking in their boots, unless they are so old and perhaps already bedridden to not to care.

Yes... I am likely guilty as most. I have found that there are many people (maybe not on these boards) that will take a rule of thumb, output of a calculator, or the word of a FA and just run with it. I tend to like the Fido RIP calculator. I've calculated out 40 through 60 years with success (less than 4% WR).
The OP really may have a point assuming one believes Firecalc is a predictor of reality. If firecalc really just uses sequential segments of previous markets, the longer the time frame (40 or 60 years), the less segments there are to test.
I think people focus on success rate. However, the more interesting part how much is left over at the end at the 75% or 50% confidence level when you are 100% success. No, I'm not saying to used those withdraw rate. But if you plan for 50 years (whatever the number)... after say 10 years... you may find that not only you have more inflation adjusted money, but less years of planned life expectancy. In this case... increase spending. So why not every year when the pot of inflation adjusted money is higher?
I use these calculators to provide warm fuzzies... the feeling that there is a reasonable chance of affording ER. But as the life expectancy drops (years left)...estimations should be more accurate... both in dollars and life expectancy (possibly).
 
My understanding is that Firecalc is a tool that should pretty much show the same results as the Trinity Study and Bengen's paper that essentially determined the 4% safe withdrawal rate.

I think that study was for 30 year retirements. RE many not fit the 4% rule as well. But the thing to remember is there are also many cases where you end up with large portfolios.
 
It can't fail, because your report told you that 3.3% was 100% successful in all periods, and this is just one of those periods.
I think you are making a mistake here. ...

I'll be concise and factual - no, I'm not mistaken. ;)

Now I'll add, I appreciate when people point out mistakes I make - that's how I learn. But in this case, I'm not mistaken.

The tool will tell you 100% success in all periods that are in the historic dataset. If history repeats itself, you are covered! But, your upcoming retirement STARTS now, so it covers periods that are NOT YET IN THE DATASET. The 100% success in the historic record is NOT a guarantee of 100% in the future.

I fully realize that my postings on this subject are repetitive, yet, I add to that repetition by attempting to point out the plainly obvious in each post, that my comments are within the historical data set. I mean, really, how could it be otherwise? This gets to the point that I feel I will be attacked for being condescending, you can't win! :facepalm:


In that same post, I said (bold mine):

Of course, this is just a strict reading of the numbers...

but you can't fail within that data set.

And I mention something similar in every post I made to this thread (bold mine):

think about how a historical reporter like FIRECalc works,

Actually, that is not true (historically).

Historically, it has to work. If I had 100% success at all points in history, then I had... 100% success at all points in history!

We know the future may look different,

But when applied to the historical data,

... though clearly it is only a look at history


Was I unclear? :facepalm:


Moreover, a 100% success in FIRECalc with more near misses is not the same as a 100% success with no near misses. If all you see is 100%, you are not necessarily comparing two equal scenarios.

:nonono:

I addressed this in my post as well (once again, emph mine):

If we want to look at this in a more general sense, increasing your withdrawal will of course reduce your portfolio in relative terms going forward. It may bring you closer to failure,

If after a more careful reading, and attempt at understanding my posts, you have some supported reasons to inform me that my analysis of what FIRECalc tells us about the historical data is somehow flawed, misleading, or unclear, please help me by pointing those out, so I can clarify, or correct myself....


another datapoint that I look at with firecalc is the lowest value the the portfolio reaches @ 100% success rate. ...

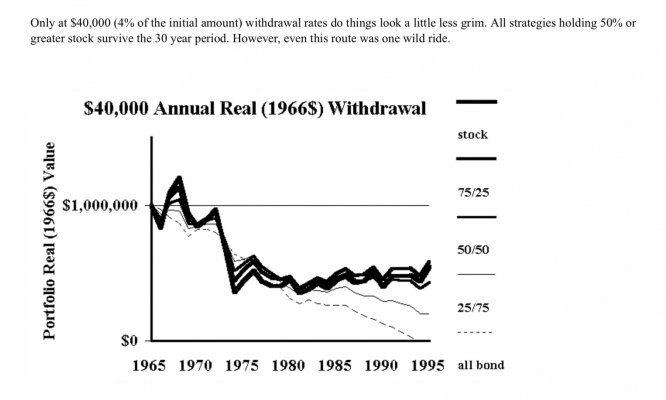
Agree, looking at the dips can be very informative. I suspect that many here have not fully appreciated how deep those dips can go, even with a conservative approach and variable withdrawals. I started a thread on this, probably years ago, try searching for 'scary dips'.

If I am getting down to one or two years of expenses, I know my margin is small to failure. If it is large, there is already a buffer built in vs historical. ....

Well, one to two years is probably too late to react, but yes, a look forward is a prudent step. I think the modified-RMD type approaches are a valuable analysis. in overly-simple terms, if your life expectancy is not expected to exceed 15 years, you want at least 15x portfolio, conservatively invested.

bold mine...
... If the future is worse than historical, FC doesn't help much.

Sure it does. It gives you something to use as a base. How you account for future unknowns is up to you.

If you plan to vacation somewhere, it can be helpful to know the average, and record high/low temperatures for the time you will be there. A new record may be set while you visit, and how you plan for that is up to you, but I sure would not ignore history - it is useful.

.... But when valuations are high and interest rates are low, I still maintain that firecalc will understate your failure rate if it shows one. ...

A thousand times, no! Again, this is not my opinion, this is fact (assuming no actual calculation or data table errors in FIRECalc).

The failures that are shown are from those bad periods. It doesn't understate them, it states them!


Personally, my planning consisted of saving 25 times spending and investing to keep pace with inflation. I don't need any equities to do that. Any funds in excess of 25X are invested in equities. It's as good as any plan I have seen. No guarantees of course.

I'm curious if you can really expect the 25x portion to keep pace with inflation if not invested in some equities (that much in TIPS?). But if the above 25x is in equities, and is large enough, that would probably work (historically).

-ERD50
 
Last edited:
Yes... I am likely guilty as most. I have found that there are many people (maybe not on these boards) that will take a rule of thumb, output of a calculator, or the word of a FA and just run with it. I tend to like the Fido RIP calculator. I've calculated out 40 through 60 years with success (less than 4% WR).
The OP really may have a point assuming one believes Firecalc is a predictor of reality. If firecalc really just uses sequential segments of previous markets, the longer the time frame (40 or 60 years), the less segments there are to test.
I think people focus on success rate. However, the more interesting part how much is left over at the end at the 75% or 50% confidence level when you are 100% success. No, I'm not saying to used those withdraw rate. But if you plan for 50 years (whatever the number)... after say 10 years... you may find that not only you have more inflation adjusted money, but less years of planned life expectancy. In this case... increase spending. So why not every year when the pot of inflation adjusted money is higher?
I use these calculators to provide warm fuzzies... the feeling that there is a reasonable chance of affording ER. But as the life expectancy drops (years left)...estimations should be more accurate... both in dollars and life expectancy (possibly).
Yeah - run Firecalc every 10 years, decreasing the time period by 10 years. Sounds like a plan!

Of course, since I use % portfolio remaining, I don't do any inflation adjusting and get an annual reset. But I'll probably adjust up the withdrawal %, maybe every 10 years, or every 5 years once we cross 70. Haven't decided exactly how to do that yet.

I may consider using the IRS RMD tables once I reach 70.
 
Last edited:
Yeah - run Firecalc every 10 years, decreasing the time period by 10 years. Sounds like a plan!

Of course, since I use % portfolio remaining, I don't do any inflation adjusting and get an annual reset. But I'll probably adjust up the withdrawal %, maybe every 10 years, or every 5 years once we cross 70. Haven't decided exactly how to do that yet.
The problem with adjusting up means I probably won't spend it unless I'm giving it away. I'm pretty sure that after 80 I won't have the desire to spend as much time on vacations as I want to now. Of course, I may spend more for every week than I do now.
 
The problem with adjusting up means I probably won't spend it unless I'm giving it away. I'm pretty sure that after 80 I won't have the desire to spend as much time on vacations as I want to now. Of course, I may spend more for every week than I do now.
I don't have a problem giving it away and would be happy to give more, and feel a lot more comfortable giving more, as I get older.

I may not travel as much when I get older, but I expect to pay more to travel - assistance, first class airfare, taxis, private tours, etc.

Heck, I may decide to spend money on a lot more assistance at home too!

Right now I don't feel that I can adjust up my withdrawal %. When I'm older and have more market years under my belt, I may feel like I can.

We're not spending all we withdraw currently anyway, and that's with gifting as 20% of our budget. So it's kind of moot. But you never know the emergency or big ticket item that might have you pulling $200K+ from your retirement portfolio. We have room to do this as any time.
 
Last edited:
I am assuming that when folks are discussing firecalc results they are referring to the default portfolio setting of Total Return or Mixed Portfolio which uses historic data. If you compare those results to the results one achieves using Bernstein's, Ferri's or others expected returns going forward, the differences are dramatic. I think they make a very strong case that future returns will be muted compared to historic returns. IOWs, using historic returns to determine your SWR going forward may lead to increased failures. Since that is what I believe, I would not increase my SWR after a good year just because rerunning firecalc gives me a successful result.


Sent from my iPad using Early Retirement Forum
 
Not our responsibility, but I worry about members who aren't able to sort fact from outright speculation here anyway.
  • There are many great posts (what we know),
  • others that ask good questions (what we don't know),
  • and others that are simply unfounded (what we don't know we don't know).
Unfortunately the latter might be hard to recognize by those who haven't worked through the nuts and bolts of retirement income planning themselves.

In this thread we have a few looking at present conditions (even exaggerating same) and making unfounded claims, who are for some reason unable or unwilling to review or compare to past history, or even address them when offered.

That said, FIRECALC doesn't try to predict the future, nor does it offer any guarantees - clearly stated in the supporting text. The future might be worse than the past (though the past isn't all rosy by any stretch), and it's wise to plan accordingly. But it's not a foregone conclusion as some would have us believe.

Good luck...
 
Last edited:
Firecalc, from my understanding, tells you how you WOULD have done given historical info. I hope I have that right. It is but one tool to help guide you if you are in the ballpark based on historical information.

I think any plan should be flexible pending market conditions. Of note, I ran 2 scenarios. I like audreyh1's % of portfolio method. I had intended to use a fixed amount, inflation adjusted. Interestingly, they both gave 100% success for my numbers, but the fixed amount yielded a higher average portfolio amount. (3% WR/yr = fixed amount).

I also like Fidelity's RIP calculator. It tells you upfront that it assumes WORSE than historical averages for rate of return. So far that has been the toughest test for me to pass.
 
... I think they make a very strong case that future returns will be muted compared to historic returns. ...

Not an unreasonable assumption, IMO.

However, you need to consider if that really means anything relative to a FIRECalc run...

IOWs, using historic returns to determine your SWR going forward may lead to increased failures. Since that is what I believe, I would not increase my SWR after a good year just because rerunning firecalc gives me a successful result.

So here's the thing - a historical tool like FIRECalc will point out how you would fare in the very worst periods. For the most part, we ignore the averages. I see very few posts making reference to the averages reported by FIRECalc, usually only when they are making some statistical observation.

Averages really aren't that relevant. The real question is: Will the future be worse than the worst of what is in the historical data set? Worse than the Great Depression? Worse than the inflationary 80's?

I'd be ecstatic if future returns are muted compared to historic returns. Look at the distribution of results in a FIRECalc chart with a conservative WR - it's tough to eyeball, but I'd estimate that roughly 3/4 of them end up with more than they started with. So 'muted' returns would eat into that a bit, but unless the future is worse than the past worst case, there will still be no added failures. And 'muted' means we succeed- it would take 'horrific' to add failures.

Of course, we could get 'horrific', no Crystal Ball.

-ERD50
 
Some gurus have pointed out the need to distinguish between SWRs computed via historic calculators and those calculated via Monte Carlo calculators using expected returns. Maybe SWRh? Bernstein wrote a series of articles on Efficient Frontier where he pulled out a 30 year historic cycle that he felt most closely resembled the present. He chose 1966 to 95. It is pretty interesting. The Retirement Calculator from Hell.
http://www.efficientfrontier.com/ef/998/hell.htm

"Although historical market analogizing can be both embarrassing and dangerous to one's wealth, this market looks an awful lot like 1966. It would behoove anybody with an investment horizon stretching another 30 years to consider the 1966-95 as a useful reality check. "
The other 4 articles expand on the subject a little. The article was written in 2001. I believe his present expected returns are even more bearish.


Sent from my iPad using Early Retirement Forum
 
Some gurus have pointed out the need to distinguish between SWRs computed via historic calculators and those calculated via Monte Carlo calculators using expected returns. Maybe SWRh? Bernstein wrote a series of articles on Efficient Frontier where he pulled out a 30 year historic cycle that he felt most closely resembled the present. He chose 1966 to 95. It is pretty interesting. The Retirement Calculator from Hell.
DATAQUEST

"Although historical market analogizing can be both embarrassing and dangerous to one's wealth, this market looks an awful lot like 1966. It would behoove anybody with an investment horizon stretching another 30 years to consider the 1966-95 as a useful reality check. "
The other 4 articles expand on the subject a little. The article was written in 2001. I believe his present expected returns are even more bearish.


Sent from my iPad using Early Retirement Forum
If the prediction was to start the 1966 clock in 2001, it was way off the mark. We've recovered from the 1973/4 crash and haven't gone into hyper inflation (yet). That's the problem with trying to predict the future. It hasn't happened yet.

I'm waiting for pb4uski to put up the graph showing me wrong. :facepalm:


That would be cool to see a 2001 to 2015 graph next to 1966 to 1980 in real terms. You think it's way off? The last 5 plus years have been amazing with low inflation but the first nine plus weren't too hot.


Sent from my iPad using Early Retirement Forum
 
Some gurus have pointed out the need to distinguish between SWRs computed via historic calculators and those calculated via Monte Carlo calculators using expected returns. Maybe SWRh? Bernstein wrote a series of articles on Efficient Frontier where he pulled out a 30 year historic cycle that he felt most closely resembled the present. He chose 1966 to 95. It is pretty interesting. The Retirement Calculator from Hell.
DATAQUEST

"Although historical market analogizing can be both embarrassing and dangerous to one's wealth, this market looks an awful lot like 1966. It would behoove anybody with an investment horizon stretching another 30 years to consider the 1966-95 as a useful reality check."
What on earth?

The quote you picked above in red is in the context of Bernstein's opening assumption in blue below:
Retirement Calculator from Hell said:
Most of you have seen the nifty retirement software available from the likes of Vanguard and T. Rowe Price which provides the mathematical muscle to help you plan your retirement. Input your retirement age, expected lifespan, required annual income, rate of inflation and investment return, and hey presto, you find out that to avoid a golden years diet of Alpo you need the GDP of the average Central American republic.

These calculators all make the same erroneous assumption -- that your expected rate of return is the same each and every year. In other words, let's assume that the real (inflation adjusted ) rate of return of the S&P 500 will be 7% in the future. You might conclude that you can withdraw an inflation adjusted $70,000 of your $1,000,000 Vanguard Index Trust 500 IRA each and every year indefinitely, and maintain yourself with the same real income in the long run. And you'd be wrong.
FIRECALC most certainly does NOT assume a 'rate of return the same each and every year' or a 'real (inflation adjusted) rate of return of 7% for the S&P 500' - that's a preposterous assumption frankly.

And the Calculator from Hell article you linked us to also notes a 4% WR was successful during this horrible period - very much like the results you'd get from FIRECALC.
Retirement Calculator from Hell said:
Only at $40,000 (4% of the initial amount) withdrawal rates do things look a little less grim. All strategies holding 50% or greater stock survive the 30 year period. However, even this route was one wild ride.
 

Attachments

  • image.jpg
    image.jpg
    202.2 KB · Views: 10
Last edited:
You are so he'll bent on starting a fight that you aren't even reading the article before hammering down. Read it again.


Sent from my iPad using Early Retirement Forum
 
Interesting thread. To me, 100% means that under the worst case scenario available based on the past, my plan succeeds... which in turn means that there are lots of scenarios that are quite likely where I could have spent much more and still been solvent.

The principal worry most of us have is spending too much and running out of money sufficient to provide for our target lifestyle. However, I am almost equally worried about the inverse... that I will be too conservative now while I am younger and have the energy to travel and enjoy our wealth and will ultimately end up with too much money late in life where I don't have the energy to enjoy it so it goes to charity or the kids. Not that money going to charity or our kids is tragic, but I will wonder or lament that perhaps I should have replaced that older but still good vehicle earlier with one that I would have enjoyed more, or traveled more, or taken DW and our kids on that trip we all cherish in our memories, or whatever.

My thinking is that any of these projection tools is only forward looking... they don't really know whether I worked for the last 3 years or was retired for the last 3 years. So in theory, if at any given point in time I adjust my spending upward but limit the increase so I still have a 100% success rate for my given time horizon, then there probably isn't a lot bad that can happen, especially since I have the flexibility to tighten my belt if needed.

So my plan is to revisit my spending level every few years as if I am retiring anew, and if the tools suggest that I can spend more, then I'll increase my spending and splurge/enjoy a bit more, if not then I'll stay the course and reassess in a few more years. I think this approach will still ensure that I don't run out of money as much as anyone can without an awesome crystal ball while at the same time allowing more spending where prudent and reducing potential second thoughts later in life.

However, I like the idea of once I am 70 or so and our pensions and SS are on line of just using an RMD approach if there is enough flexibility in my spending to do so, or perhaps RMD after a 20% haircut (or something like that).
 
Last edited:
... It would behoove anybody with an investment horizon stretching another 30 years to consider the 1966-95 as a useful reality check. " ...

Isn't that exactly what FIRECalc and other historical reports do?

-ERD50
 
I'm also an inverse worrier. Which is why I don't reinvest funds I don't happen to spend in a given year. I'd rather find a way to spend them soon - in the next few years.
 
Isn't that exactly what FIRECalc and other historical reports do?

-ERD50

Yes - but that's not the point of that statement. The point is that he believes that period is most representative of our current conditions. So if you were to pick any one of the output graphs of Firecalc, the one starting at 1966 would be most like what he believes 2015-2045 would look like.

Everyone is so conservative here because the downside risk of running out of money is so much greater than the upside risk of having too much left over when we croak.

If we were penalized equally in both cases - like getting poked in the eyes with a sharp stick if we had too much money left over right before we die, then this discussion would be quite different. If that were the case, of course people would be adjusting distribution amounts the closer they got to their death - the planning horizon would be way shorter and guesses about the future would be more accurate. If I'm 85 and drooling with $10M socked away it's pretty likely I'm not going to be spending that down without trying pretty damn hard to do so.
 
In that Bernstein article, he compared the approach for drawing a fixed COLA'd percentage of the initial portfolio value vs. drawing a fixed percentage of the present value.

He concluded:

If you can be more flexible and spend a fixed percentage of your nest egg each year, then you can indeed keep you entire retirement stash in stocks and spend 5% annually. Just remember that your stipend will likely fluctuate wildly over the decades of your retirement. Keep a few cans of Alpo in the cupboard if you decide to go this route.

The above is not at all surprising. What happened is that in the past, a portfolio could drop 50% or more without you drawing anything. So, if you draw a fixed percentage, if your portfolio is halved, can you live on less than 1/2 the dollar amount of the previous year expenses?

I guess I can do it, but it is going to be very hard. My discretionary spending is high, but it is not 50% of the total.

On the other hand, if you draw a percentage of the initial porfolio value, you would build up reserve during good years. It is so that during bad years, you can maintain the same expenses. Your percentage relative to present portfolio may be high, but not as high as it would be if you have upped your spending and now have problems throttling back.
 
Last edited:
Is it legitimate to recalculate my maximum safe withdrawal over time, and increase it when the market is good? Do I have to decrease it when the market is bad, or does my original calculation remain safe even when the market drops over time? Thanks.


Yes, it is legit to recalculate. When markets go up, you can increase WR, or decrease risk and have the same success rate.

When market is bad, either decrease WR or go for higher returns if you are comfortable with the risk.

It should be similar to having an annual physical.


Sent from my iPad using Early Retirement Forum
 
You are so he'll bent on starting a fight that you aren't even reading the article before hammering down. Read it again.
I'd suggest you read the article again, but I refrained from suggesting that in my earlier reply out of courtesy to you.

Again, the quote you cherry picked out refers to calculators that assumed 7% real rates return and/or linear returns - nothing at all like FIRECALC. He then picks a bad period, a good illustration, and shows how 7%, 6% and 5% inflation adjusted withdrawals all failed in less than 30 years. However, 4% was successful, just as the Trinity Study showed and just as FIRECALC results show. He then shows 7% and 5% of remaining portfolio also fail.

Note this passage in the article you choose, that follows the one you've chosen to use out of context:
One point cannot be made often enough -- when you retire, are you going to be withdrawing a fixed inflation adjusted amount on a regular basis, or are you going to be withdrawing a fixed percentage of your portfolio? This is not a semantic fine point. If you need a fixed amount, plan on withdrawing no more than about 4% of your starting amount in inflation adjusted terms. A fair dollop of bonds won't hurt in this situation.
No one here who knows anything about SWR studies or FIRECALC would be surprised that only 4% was successful over a bad 30 year period vs the other scenarios above.

It am sure it's not deliberate, but you're simply misleading people, and your examples as to why FIRECALC has "problems" and your examples of why conditions are different now are also easily contradicted with a cursory look at the history underlying FIRECALC. I just hope other members can see that.

But I wish you well, honestly...
 
Last edited:
I'd suggest you read the article again, but I refrained from suggesting that in my earlier reply out of courtesy to you.

Again, the quote you cherry picked out refers to calculators that assumed 7% real rates return and/or linear returns - nothing at all like FIRECALC. He then picks a bad period, a good illustration, and shows how 7%, 6% and 5% inflation adjusted withdrawals all failed in less than 30 years. However, 4% was successful, just as the Trinity Study showed and just as FIRECALC results show. He then shows 7% and 5% of remaining portfolio also fail.

Note this passage in the article you choose, that follows the one you've chosen to use out of context:


No one here who knows anything about SWR studies or FIRECALC would be surprised that only 4% was successful over a bad 30 year period vs the other scenarios above.

It am sure it's not deliberate, but you're simply misleading people, and your examples as to why FIRECALC has "problems" and your examples of why conditions are different now are also easily disproven by a cursory look at the history underlying FIRECALC. I just hope other members can see that.

But I wish you well, honestly...

Congratulations, you win. My suggestion, however, to the OP remains the same. I gave him the same answer I would give my brother or sister. That valuations are high, interest rates are low and future returns are expected by some experts to be lower than historic returns. So, not only would I not ratchet up my SWR five plus years into this bull market but I might even go back a few years and use that portfolio value to calculate my SWR. Clearly, everyone here disagrees. That's ok with me. I do wish the discussion was more civil. Did you see where Vanguards Target Date funds are decreasing their US equity and bond allocations in favor of international equities and bonds? I find that interesting.


Sent from my iPad using Early Retirement Forum
 
Back
Top Bottom