Are you quite so sure that a significant number of FIRECalc users aren't also misinterpreting the results in exactly that way? Judging from the general comments here at ER.org I'd say it's likely they are. And if that's true, isn't it useful to point out that the results generated by FIRECalc aren't exactly what they appear at first glance? ...
You could very well be right about that (I only hedge that as I don't have any real numbers one way or the other, but I don't doubt it at all).
And yes, it it is useful to point that out. And isn't that what I'm doing - pointing out what FIRECalc can and cannot do?
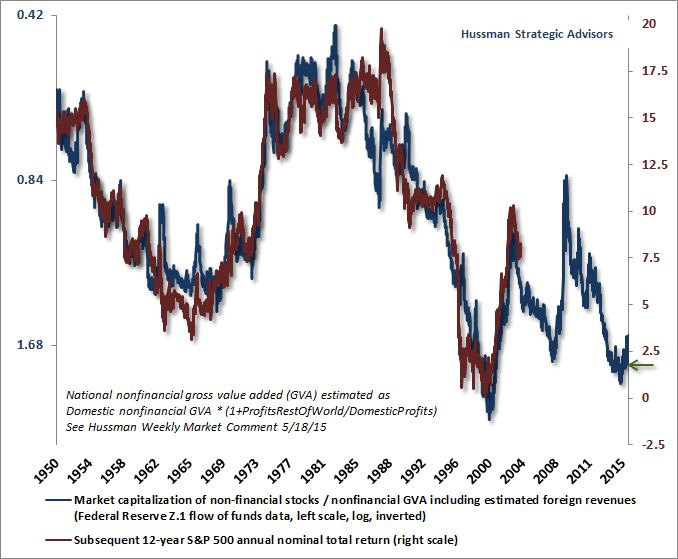
That sounds impressively rigorous until you note that today's valuations are about as bad as any time in history. See above chart for equities. A chart of historic bond yields says the same thing.
So if you believe valuations matter and if you believe today's valuations are about as bad as anytime in history then one might conclude that the worst returns in history is more of a base case scenario than a downside one. And if you believe that, then FIRECalc lends very little guidance and perhaps a whole lot of overconfidence.
Valuing the market to try to estimate future returns can be a tricky thing. Regardless, I agree with your concept - if the market is currently at/near a peak, then we are more likely looking at a scenario that resembles the lowest lines on a FIRECalc chart.
That's why I like to
start with the 100% success numbers for these discussions. IIRC, something like 3.2% WR is historically safe for an extended retirement (45 years?). Remember, that is a starting WR, adjusted for inflation going forward (not recalculated on future portfolio balances). So yes, if we are in a position similar to 1966, or a few other bad starting years, 3.2% could be marginal, or of course, even fail if things are even worse than history.
So if we don't trust our ability to measure the value of the market, a WR < 3.2% is indicated (at least based on history). How much margin you want to give yourself over that is personal preference, and really is trying to guess the future, which none of us can really do. To an extent, retiring is a leap of faith, and we should take reasonable precautions/preparations - but 'reasonable' is subjective'.
So if people misunderstand that, they should seek enlightenment, for their own good.
An interesting (IMO) aside to this is to apply the "Retire Again & Again" approach to the data. By definition, if you start with a 100% historically safe portfolio for say a 45 year time frame (assume it is 3.2% for now), you can increase your withdraw to 3.2% of any portfolio increase, and use that new increased amount (inflation adjusted) going forward. Since 3.2% succeeds in any time frame, it will succeed at a any point along the way, not just the start. This does the best I've seen of leveling off the portfolio - allowing you to spend down any increases, while maintaining safety for the bad terms.
If you want to call that data-mining, or curve fitting, yes, it pretty much is. But I think it is a valuable insight to what the data is telling us.
Bottom line, it depends how you interpret "95% success". It isn't 95% success at any time you might start. It is just what FIRECalc says it is (that many people may be misinterpreting), success in 95% of the periods in its history. If you start in 1966 with the defaults, your chance of success is 0%.
-ERD50
")
