Market coming up on 2 years of flat.

The widely accepted definition of a correction is a 10% drop.

From 5/21/2015 to 2/11/2016, the S&P lost 14%. That certainly counts as a correction.

Even now, it still has not recovered to the old high. They will say that the correction has ended when the market recovers the loss.
 
The widely accepted definition of a correction is a 10% drop.


Yes.. Indeed.

And I also think if we remained 10 percent or more BELOW prior market high we would still be in a technically defined bull market correction.

Since we are still below prior highs but *less than 10 percent off of those highs *. we might be "recovering from the bull market correction".

Or we might have killed the bull in the process.

traders market ... Except that even volatility is anemic.
 
The quoted article has a chart showing that in the past corrections, the market would recover to its previous high well within 12 months. And the average "recovery" time is only 5 months. That is amazingly short.

And the point the author is making is that this time the recovery is longer than average.
 
All my stocks or stock groups went up big today and yesterday. I should go away more often.
 
The quoted article has a chart showing that in the past corrections, the market would recover to its previous high well within 12 months. And the average "recovery" time is only 5 months. That is amazingly short.

And the point the author is making is that this time the recovery is longer than average.

^ exactly why I wanted to share that article.
 
All my stocks or stock groups went up big today and yesterday. I should go away more often.

Today, the S&P is up 0.70%, while my stocks are up 1.02%.

Yesterday, the S&P went up 1.37%, and my stocks were up 1.43%.

But when the S&P dropped, my stocks usually dropped more.

What went down more rebounds more. That's what one gets with high-beta stocks.
 
...

What went down more rebounds more. That's what one gets with high-beta stocks.
It's always sweet when the market goes your way and your choices do better then the alternate choices. Also, it's a consolation prize when your choices do less worse then the alternates on bad days.
 
A weird market...Common stocks jumping and threat of a rate hike, one would think the preferreds would sag a bit. They have been jumping too. People keep climbing in searching for yield. Some of mine went up a couple bucks in past week and they were already past call and above par..Since they are income issues why wait all year for the dividends when you can snag 6 months to 2 years worth right now....Bye Bye... And buy something else.


Sent from my iPad using Tapatalk
 
... Also, it's a consolation prize when your choices do less worse then the alternates on bad days.
I wish that were true more often. My high-beta stocks go more than the total market in both directions. But I like to play with fire. I am only 60% in stocks, but the total portfolio behaves like 100% stock.
 
All my stocks or stock groups went up big today and yesterday. I should go away more often.

Same here. Individual portfolio up ~5% in two days. Just hit a new all-time high.

Which makes me wonder: when exactly in May are we supposed to sell and go away :confused:
 
Right after a 5% move in two days? :LOL:
 
From a net worth standpoint, I'm at an all-time high as of last night's close. However, when you take into account additional investments, I'm still probably down about 1-2% from my last peak set in May 2015.

However, if you count a "correction" as a 10% loss or more, I don't think there's been a period since that May 2015 high that I, personally, have been down 10% or more. I only keep month-end numbers in my Excel spreadsheet, so I guess it's possible that there may have been a mid-month period where I briefly had a 10+% loss?

Earlier on in the year, in January or February, I think, I might have been down about 7.5%, net worth-wise. So, factoring in additional investments up to that point, I guess I could have briefly gone over that 10% threshold.

The last time I can remember what I'd consider a serious correction was back in 2011. From July to August, I lost about 15%. And I didn't gain it all back until sometime in early 2012.
 
So, I was looking at this thread. Based on the SPY close today @ 209, compared with the close two years ago, May 23 @ 190, plus the divs, it looks to me like total return has been around 14%, or 7% per year. Below the long term average but definitely not flat. Not bad, actually. Problem solved? :)
 
+1 Actually a tad over 7%/year... much ado about nothing. Even if you start in mid July 2014 as the OP says he had in mind when he characterized it as flat it is about 5%/year... no great shakes but still not flat.
 
So, I was looking at this thread. Based on the SPY close today @ 209, compared with the close two years ago, May 23 @ 190, plus the divs, it looks to me like total return has been around 14%, or 7% per year. Below the long term average but definitely not flat. Not bad, actually. Problem solved? :)

Yes! But I was referring to the market first hitting 2000.... so different time frame.

It was 205 a few days ago... and 200 a few (2) years ago :confused:. And my starting point was S&P first hitting 2000 (200 on SPY) which was July 2014... not 1900 (190 on SPY) ...so a 100 point difference in the starting point... But then we've said that now for the 28th time...

SO, (209-200)/200 = 4.5% total over 2 years. 2.25% per year.
Plus dividend yield of 2% per year .... less inflation of 1.9% per year.
= 2.35% real return per year as of today.

And from earlier this week. (205-200)/200 = 2.5% over 2 years.... 1.25% per year. Plus dividend yield of 2% per year... less inflation of 1.9% per year = 1.35% real return per year as of last week. Not zero but pretty damn flat.

No new highs in over a year now.

You can pick your time frames.... I opened the thread with very specific market number, which was a well bench-marked, well-quoted market milestone, which was the first time SP500 crossed 2000. It's a slow grind.

Some are saying the low volume happening now and low volatility is driving options prices way way down. Might be interesting to buy some long duration options given the unique market situation. Maybe some opportunities in Mr. Market after all on the option side even as we grind relatively sideways....

The S&P 500 is doing something extraordinary — nothing!
 
YNo new highs in over a year now.

You can pick your time frames.... I opened the thread with very specific market number, which was a well bench-marked, well-quoted market milestone, which was the first time SP500 crossed 2000. It's a slow grind.

Some are saying the low volume happening now and low volatility is driving options prices way way down. Might be interesting to buy some long duration options given the unique market situation. Maybe some opportunities in Mr. Market after all on the option side even as we grind relatively sideways....

The S&P 500 is doing something extraordinary — nothing!

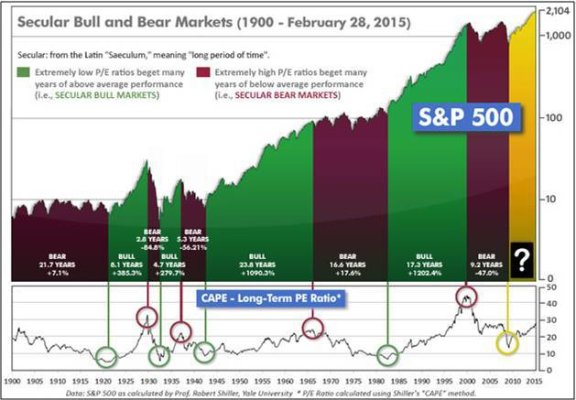
But this is often the case, depending on the timeframe. For example, the S&P500 first breached 1500 in 2000. Seven years later it recovered from the Dot Com bust and once again breached 1500, only to fall again with the sub-prime bust. Six years later it finally passed 1600. That's a 12-year period where it was range-bound, never breaking over 1600. There were periods of volatility and big drawdowns, but there was a definite band of activity.

The market also climbed for six straight years, 2009-2015.

So there ya go...
 
With the bank paying a tenth (or less) a cent a year 2.5% seems a goldmine.

Everything is relative I guess.
 
... the S&P500 first breached 1500 in 2000. Seven years later it recovered from the Dot Com bust and once again breached 1500, only to fall again with the sub-prime bust. Six years later it finally passed 1600. That's a 12-year period where it was range-bound, never breaking over 1600. There were periods of volatility and big drawdowns, but there was a definite band of activity...

Yes.

Accumulators who kept on buying between 2000 and 2013 made money because they bought during the dips, even though the S&P was the same at the endpoints of this 13 year period.

People who bought, held and never traded during this 13-year period only made money from the dividends, which were cancelled out by inflation. In effect, they broke even.

They don't call this the lost decade for nothing.

So, depending on what you did during the above period, you could 1) lose money, 2) make money, or 3) break even.
 
Last edited:
+1. Besides, the S&P 500 is one market among many markets in an investor's portfolio. Bonds, real estate, gold, emerging markets, energy, etc. all had their own cycles during that same span.
 
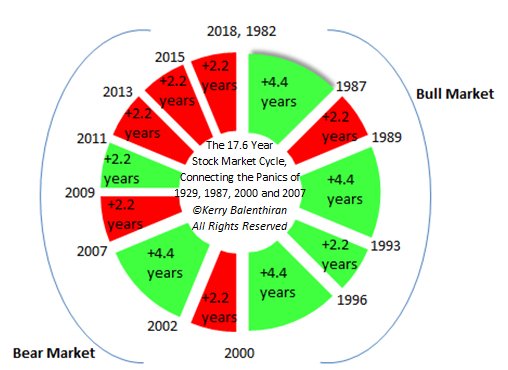
ImageUploadedByEarly Retirement Forum1465739184.349053.jpg

ImageUploadedByEarly Retirement Forum1465739230.205214.jpg

I am looking for a graphic similar to chart 2, but updated information through May 2016. Any good sources ? I've tried google Etc and after several hundred images I'm not finding it...
 
Back
Top Bottom