papadad111
Thinks s/he gets paid by the post
- Joined
- Oct 4, 2007
- Messages
- 1,135
Yawn...
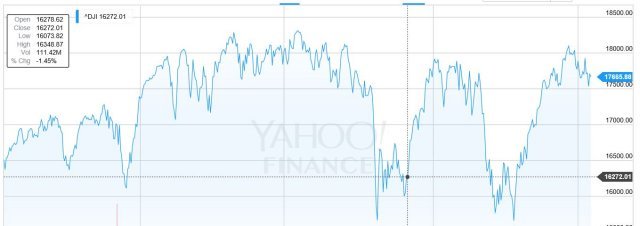
Approaching 2 years of the 2K grind... A few little loop-de-loops has been about it...
Nice to wring our hands and do nothing ...
Collect that 2.5% dividend.. And keep waiting.
Two years of a 1 percent annualized real return after inflation ...
Bogle so far is proving to be correct !
Approaching 2 years of the 2K grind... A few little loop-de-loops has been about it...
Nice to wring our hands and do nothing ...
Collect that 2.5% dividend.. And keep waiting.
Two years of a 1 percent annualized real return after inflation ...
Bogle so far is proving to be correct !


")
 I guess it's all in how we look at it. I suppose the bumpiness could be a lot worse. And yes, I agree that like I said, the *overall* movement hasn't been too extreme in the past two years.