S&P 500 vs "The Market"

OldShooter

Give me a museum and I'll fill it. (Picasso) Give me a forum ...
Joined
Mar 27, 2017
Messages
10,358
Location
City
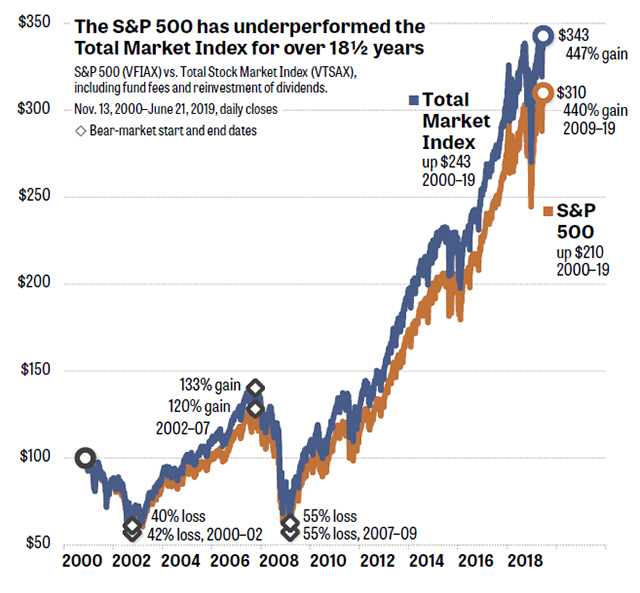
Lots of people here talk about buying S&P 500 funds. In this article, the author compares total market performance to S&P 500 performance for 18 1/2 years and shows that the total market won. I'm not too concerned about that because I expect that other time periods would probably show different results, though I do buy the principle that the total market is the place to be.

But the main reason for the post is that the article does an excellent job of discussing the 20-25% of the market that is not included in the S&P. I have not seen this discussed so clearly before.

https://www.marketwatch.com/story/shocker-the-sp-500-is-underperforming-the-market-2019-06-26
 
The S&P 500 index has ~600 stocks. The Total US Market index has ~3,600 stocks.

The 3,000 are small, mid and large cap stocks that do not meet the requirements to be included in the S&P 500 index.

Returns are quite similar, but an "Own the full haystack" approach knows that things change and small stocks become mid and large and mid become small and etc etc.

A mix of Total US and Total International (~9,600 stocks) gives you ownership in more than 10,000 companies.

It is a representation of "all" stocks as it isn't possible to own every stock.

I don't know, so I pick the Total US Stock index. I think you would be fine with the S&P 500 index as well for the US component. Many 401ks have a low cost 500 index but not a Total US market.
 
I suspect we've hit diminishing returns (no pun intended) after 500, especially considering they are market weighted. Maybe later (gotta cut the grass then run some errands) I'll look to see what % the largest few companies make up of the S&P500 funds versus a Total Market fund - I suspect it will be almost a rounding error?

That said, I've been leaning to the Total Market if I can get it at a n even or better expense ratio. Why not?

-ERD50
 
... I pick the Total US Stock index. ...
Yes. I do too. My point in the OP was not to reignite that argument, just to draw people's attention to an article that IMO does a good job of explaining why the S&P is not "The Market."
 
If I understand the chart right, the difference between the two investments is a raw 7% over 18.5 years. the SP500 at 440% and the Total at 447%. The difference between 440 and 447 is 1.5%. So a difference in gain of 1.5% over 18.5 years.

That's pretty small difference.
MW-HM080_spx_vt_20190625065703_NS.jpg
 
... That's pretty small difference.
Again: My OP was to draw attention to the good discussion of what the differences are in holdings. With the S&P at about 80% of the total market cap differences will be small and the winner will vary depending on the time period chosen.

The question, really, is whether there is more upside potential in the excluded 23% than there is in the S&P. No point in debating that because no one knows.

Edit: Now looking more at that graph I am confused. I think it says that over 18,5 years $100 grew to $343 in a total market fund and it grew to $310 in an S&P fund. That's 6.89% compounded vs 6.31% if I did the calculations right. None of those numbers squares with his 447% and 440% numbers -- it looks like they refer only to the period since the 2008 bottom. But if that's the case, then it's not apples to apples. The total market fund was ahead of the S&P at the bottom, so the two growth numbers really aren't the whole story. Not a very good chart, IOW.
 
Last edited:
I've always believed that the Total Market Index is a better reflection of the overall index. Similar to the SP 500 Index a better reflection than the Dow Index.
 
I never liked the S&P500 Index because it is an index selected by committee rather than some mathematical criteria.
 
Strictly S&P 500 investing alone hasn't given the best long term returns. Bengen changed the 4% rule to the 4.5% rule by including a percentage of small caps in the mix with your portfolio.
 
That's pretty small difference.


Yep.

If you look at a performance graph (with divs included) for VTI and VOO, the first thing you note is that they are almost identical.

Of all the things I consider in regard to my FIRE portfolio composition, the difference between the S and P 500 and the TSM seems to be of little consequence. Because both indexes are market weight determined, the stocks in the S and P 500 index dominate the TSM index in dollar value.

Now, having said all that, my largest holdings, by far, are TSM index funds. :LOL: But my results over these past decades would be very similar if I had chosen at the beginning to go S and P 500. What seems to have really mattered is AA where even small differences are significant over many years.

To actually get some significant representation of smaller cap stocks beyond the S and P 500, I have some VXF. Owning a TSM fund alone, really doesn't give you much mid and small cap exposure thanks to the "market weighted" composition of the TSM.
 
Last edited:
Strictly S&P 500 investing alone hasn't given the best long term returns. Bengen changed the 4% rule to the 4.5% rule by including a percentage of small caps in the mix with your portfolio.

But he didn't get that small cap exposure by switching from S and P 500 to TSM. He added mid and small cap exposure.

I agree that TSM is the way to go. But "market weighted" TSM funds don't give you the mid and small cap exposure many think they do.
 
And after taking into account expense ratios? Total US should be slightly higher.
I'm not sure what your point is. The author used two funds as surrogates for the indexes, so expense ratios should be baked in. No?

Yep. If you look at a performance graph (with divs included) for VTI and VOO, the first thing you note is that they are almost identical. ...
Yes, but eyeballing graphs is only a rough tool. If I did my math right, the total market beat the S&P by 58bps compounded over the 18 1/2 year period. I don't think that is negligible. Since it's as easy to buy a total market fund as it is to buy a S&P fund, like you I am going to go with the former.

... To actually get some significant representation of smaller cap stocks beyond the S and P 500, I have some VXF. Owning a TSM fund alone, really doesn't give you much mid and small cap exposure thanks to the "market weighted" composition of the TSM. ...
Yes. The Fama/French strategy as represented at Dimensional Funds argues for portfolio tilts slightly towards small cap and value stocks based on their three-factor model. Fama claims that the advantages of small cap and value are long-lasting but I wonder about that considering the number of "factor investing" funds and hucksters that are around. Why wouldn't they have bid small and value up to the point where their advantage is dulled or eliminated? None of us will probably live long enough to see enough statistical data to answer that question.

I have seen a video somewhere where Fama is bemoaning the fact that he has only 100 years of data. :LOL:
 
Yes, but eyeballing graphs is only a rough tool. If I did my math right, the total market beat the S&P by 58bps compounded over the 18 1/2 year period.
I don't think that's correct. I go with skipro33's simple observation that over the past 18.5 years, TSM was up 447% and S&P 500 was up 440%. I'll certainly take that difference if handed to me all these years later, but it wouldn't have had a material difference in my current FIRE situation. Especially when compared to critical factors such as AA decisions, riding out recessions, choosing fixed investments, etc.

If your calculation that the advantage has been 58bps annually and that compounded for 18.5 years, obviously the difference would have been much, much greater.

Not arguing that going with the TSM has had a minor advantage over the past 18.5 years, just saying it's been a small advantage. If you really want to take advantage of the small/mid-cap advantage, go with a combo of S&P 500 and VXF (market completion index fund) so you have a slightly larger small/mid-cap exposure than the large cap dominated TSM gives you.

We should also note that there have been periods within the past 18.5 years when the S&P 500 outperformed the TSM. So ya gotta get lucky on your timing too........

I guess I'm just saying that, for me, the difference between the S&P 500 and the TSM has been a yawner compared to other investment factors and sure not worth the bravado the author of the article gave it. Although, WTF. these guys have to find something to write about to make a living...... :LOL:
 
Last edited:
I don't think that's correct. I go with skipro33's simple observation that over the past 18.5 years, TSM was up 447% and S&P 500 was up 440%. ...
It's a very confusing graph. I finally figured out that the percentage gain numbers refer to the gain since the previous bottom ("2009-2019") not to the whole 18 1/2 years.

IOW the 447% refers to the total return of a VTSAX position since the 2008 bottom and the 440% refers to the VFIAX total return since that bottom. But note that at the bottom VFIAX was lower than VTSAX, so the two percentage numbers are not even comparable at that level. IMO it is stupid to even show them.

I took his word for it that total return on VTSAX was $243 on $100 and total return of VFIAZ was $210 on $100. I then did the calculations based on 18.5 years of compounding. Check my math if you like, but that's how I came up with the 58bps number.

Agree totally on timing. I like long periods because that makes time interval cherry-picking harder, but in the case of most funds the total life of the fund may not be enough to get a statistically valid result. So we end up placing our bets based on gut feel even though we don't think we are doing that.
 
From M* performance tabs for 15 years:

VTSAX cagr = 9.05%

VFIAX cagr = 8.78%

for 10 years:

VTSAX cagr = 14.72%

VFIAX cagr = 14.68%

Not a home run for Total Stock Market but maybe a single.
 
Yup. Playing around in Portfolio Visualizer, in the runs I made VTSAX always wins by up to 50 basis points (1985 to today) but usually by much less. The time interval chosen definitely affects the results. The author of the linked article appears to have picked a particularly favorable interval.
 
...
I took his word for it that total return on VTSAX was $243 on $100 and total return of VFIAZ was $210 on $100. I then did the calculations based on 18.5 years of compounding. Check my math if you like, but that's how I came up with the 58bps number.
...

The ratio of $243 over $210 is 1.15714, which is 1.00792 compounded over 18.5 years.

That difference of 0.8% is small, but if it is "free" one might as well claim it.

It is "free" if it does not come with a teeny tiny bit more volatility. This, I have not checked.
 
Last edited:
I have seen a video somewhere where Fama is bemoaning the fact that he has only 100 years of data. :LOL:

That 100-year of data is the past anyway.

Who can be sure that the US in its current form will exist in the next 100 years?

The Roman Empire lasted from 27BC till 1453. Too bad they had no stock record for us to study. :)
 
Last edited:
... Who can be sure that the US in its current form will exist in the next 100 years? ...
He is coming at it strictly from a statistical point of view, looking at things like t-tests, shape of the data distributions, etc.

Whether that point of view gets us much as investors is debatable. I'm not much interested. He is working to understand how the market works, with the EMH and the three-factor model as examples. I look instead at the empirical data like the semiannual SPIVA and Manager Persistence reports. Those tell me what time it is; I don't need to know how the watch works.
 
The ratio of $243 over $210 is 1.15714, which is 1.00792 compounded over 18.5 years. ...
Well, 1.5714 is 15% more money. I have no idea what the rest of your calculation might mean. Mine:

$100, 18.5 years
-at 6.89% compounded, (1.0689^18.5) is $343
-at 6.31% compounded, (1.0631^18.5) is $310
so, 58bps better performance for the total market fund. YMMV whether you think 58bps is significant but I'll invest based on this and hope that it continues in the future.
 
Ah. I misread your earlier post. The $243 and $210 are returns, not the present values.

OK. I will redo the simple calculation earlier.

The ratio of $343 to $310 is 1.10645, which is 1.00548^18.5, and that agrees somewhat with your number.

PS. Your number is the difference between returns, and it is correct. My number is the ratio between the returns, hence a bit lower than yours.
 
Last edited:
Back
Top Bottom