Standard deviation time frame

dallas27

Thinks s/he gets paid by the post
Joined
Jun 14, 2014
Messages
1,069
I'm studying college level finance right now, with the hopes of better understanding my retirement savings and the market. Getting a refresher course in st.dev., etc.

For broad index etf's like VIG, VEU, VWO, what is an intelligent amount of time over which historical stdev should reasonably predict the future? 5, 10,20,50 years? 100?

I think this is a question that is art not science, but, i'd like to hear opinions to learn from.


Sent from my iPhone using Early Retirement Forum
Use as much data as you can to derive the standard deviation and use current rates of return.
 
If something major changes the index or economic conditions then a historical standard deviation might be valid for only a day into the future.

I wouldn't mind assuming they would be valid for 10 years or so for a broad index. Long enough to make a long term choice, but I'd want to check on it again in the future. But I have no evidence for that, and any evidence would be historical, and you know what that means.

A few short term big swings won't contribute greatly to the SD. The bigger effect might be sampling frequency.
 
Depends on what you want to do with your stdev estimate and how much precision you need.

But practically speaking, just take all the data you can easily get. Exclude time frames if there's a strong reason to believe it's no longer iid (e.g. substantial change in the index etc).


Sent from my iPad using Early Retirement Forum
 
When you calculate any time series statistics you are making the assumption that the system is stationary. That is that the distribution statistics do not change over time. In this case the more samples you include in your measurement, the more accurate will be your measurement, and the number of samples needed for any degree of accuracy can be calculated as in the link above.

However... for the stock market this assumption is hardly likely. You will notice on this forum there is a great deal of discussion on the future rate of return for the market, will it be less than the past, the same, etc. It is the same for the variance, we know the system is not stationary, but how bad are the statistics going to be if we make the assumption that it is stationary and compute the statistics anyway?

Now we have to make assumptions about the future even though we know they will be off, hey it is the future after all. So the answer to your question really is "Who knows?"

You could make a doctoral thesis on this I am guessing. :cool:
Good luck.
 
Standard deviation does not apply to the stock market because the results are not normally distributed.
 
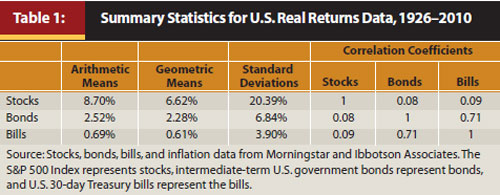
Well the stock market is not random....so calculating SD is problematic. So the thing to do is to take a random sample of the data and use that to calculate your statistics. Or you could use the statistics derived by other people. here are some numbers from a Pfau paper.

Pfau-Table-1.jpg
 
Last edited:
As I understand it...

The standard deviation (second moment) is a measure in statistics or physics of deviation of observations from the mean whether it is a normal distribution or not. In other words, it is not required for the distribution be normal to compute the standard deviation.
However….
When the distribution is not Gaussian the probabilities normally assigned to the standard deviation are not the same. Hence while you can compute a SD from a non-normal distribution, in common practice it is not the usual SD that we have come to know and love. We cannot assume for example that 95% of the observations will fall within approximately +/- 1.96 standard deviations.

Of course it has been shown many times that stock prices are not normally distributed, how could they be anyway, they are bounded by zero and infinity. Log normal is better, but they are not exactly that either. In addition from my occasionally readings on the subject the distribution changes depending on the sampling interval. In other words a one minute probability density function could be much different from one sampled daily, weekly, monthly or annually.

And as I posted before, if the distribution is not stationary, it will change from one time period to the next as well.

So what is the answer for the OP? :confused:

I dunno, but maybe could be the subject of his doctoral dissertation :angel: .
 
...... what is the answer for the OP? :confused: I dunno, but maybe could be the subject of his doctoral dissertation :angel: .

Use the results of professional modelers. That have taken the non random nature of stock returns into account and come up with some "estimates" for its variability.
 
Is there any index every in time that can be used to predict the future based on standard deviations? Every single financial disclaimer of every advisor charging money states pretty much the same as Fidelity:
"IMPORTANT: The projections or other information generated by Fidelity’s Planning & Guidance Center Retirement Analysis regarding the likelihood of various investment outcomes are hypothetical in nature, do not reflect actual investment results, and are not guarantees of future results. Results may vary with each use and over time."

Long Term Capital collapsed despite Sholes and Merton deviation analysis and fair value models and ended up going belly up. Merrill Lynch stated : "that mathematical risk models may provide a greater sense of security than warranted; therefore, reliance on these models should be limited".
 
Is there any index every in time that can be used to predict the future based on standard deviations?

In my view, no.

The long term stock investing future depends primarily on

  • The world producing more and more stuff and services (roughly GDP growth)
  • Done by stock listed companies
  • Which have to make more profit from it
  • That they get to keep for shareholders (tax rates)
  • In a stable financial (interest rates) and legal environment (revolutions, nationalizations)
On top of that you can layer Mr. Market and residual randomness, which probably is best modeled stochastically. But as a secondary effect only.

I realize that won't help OP alot, but realize that statistics make assumptions that in this specific case are likely to be wrong if applied straightforward.

If you want an answer as to what sample size is sufficient, it depends on the underlying distribution you assume. It should be buried somewhere in your statistics handbook :)

Practically speaking, keep expanding the sample size until your standard deviation varies little which each addition. Unscientific but a reasonable approach. Only works when you don't have big outliers and no small chances of a very large event occuring.
 
Back
Top Bottom