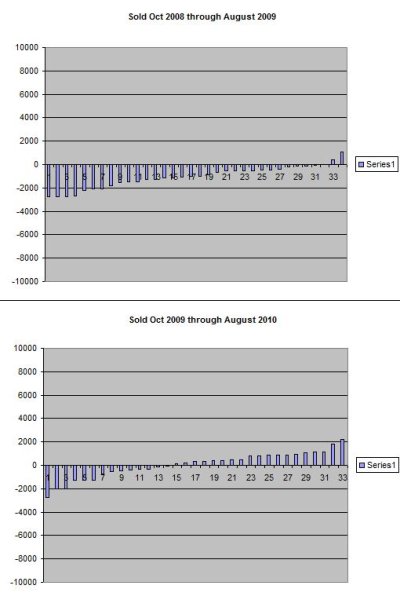
I'm publishing random picks in another thread on this board and reporting the results, along with some benchmarks.
The initial post was just over a year ago, and I just
reported how the first year went for the first batch: Appreciated 30% vs S&P at about 20%.
I really don't expect that to be sustained, but it's nice that the first batch came in above the S&P 500.
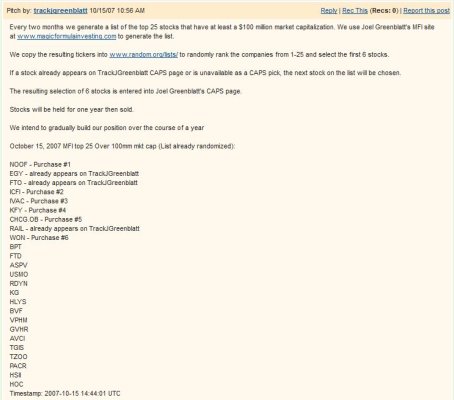
That seems like you are executing approximately the procedure outlined in the book. But I've never been clear on what happens in all cases if the random selection contains a stock already in the portfolio. Say you have a set of stocks that you've held a year, and so need "replacing". The process I follow in the other thread is to pull the screen,
remove any stock currently held, including the ones to be replaced, then randomly select from the remaining stocks. This guarantees that everything gets sold after one year, nothing gets held longer. This would not guarantee that during the next cycle, previously held stocks would not get re-bought, but there would be a gap in owning that stock.
I haven't looked at the contents of the screened list as much as you have...I literally spend just an hour or so on it, every couple of months. But what I've noticed is that there seem to be "permanent members" in the screened set of stocks. So year after year, they never get bid up to a high enough price to get out of the screen. It would seem like those might be better to avoid. But of course you can't start doing that or you'd not be following the procedure in the book.
It sounds like you didn't build-up to 24 stocks over 12 months, rather you started with 24? In that other thread, you can see that every two months, I've got 5 random picks, so target a few more stocks than you: 30.
I wonder if you have been "unlucky", or if the method isn't going to pan-out for you, or both. Do you REALLY pick randomly (i.e. use the random function in the spreadsheet)?
") .
.