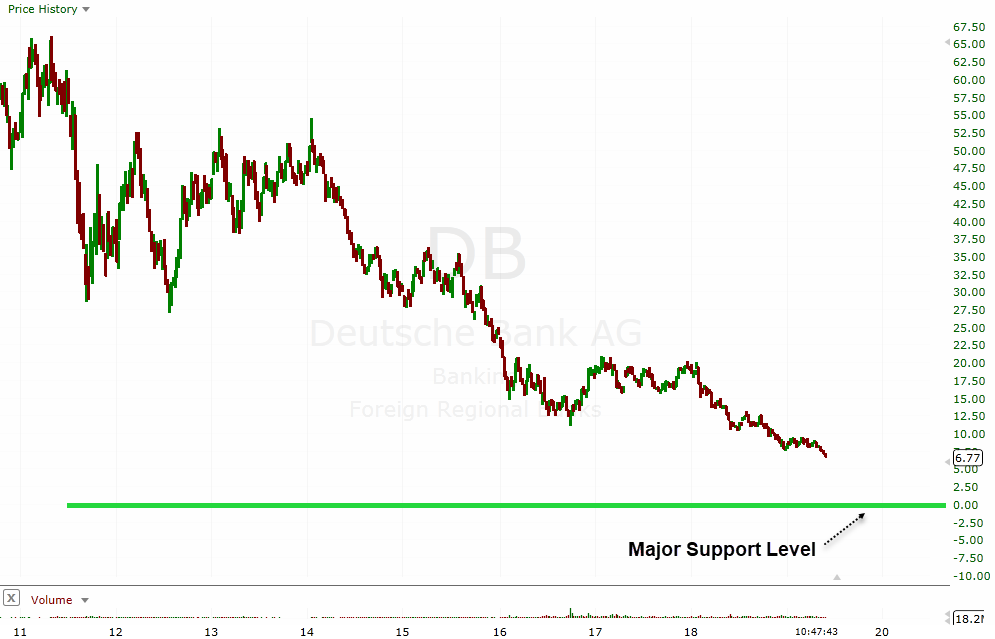
Trap Door opened today!

NYEXPAT

Thinks s/he gets paid by the post
Joined
Jul 6, 2009
Messages
1,992
Location
Miraflores,Peru
Last week I said this:

"There will be one more push to 2860 area (S&P), then we retest the Dec lows, and then rally back to new highs at about 4,000 before this Bull market is finally over in about 3 years!"

Well the S&P only rallied to 2940, with the trap door (2770) now open, I expect the market to trade down to the 2200 area again. See you all their!:dance:

I am just going to push all the buttons and hope the elevator door opens on the right floor! :D The latest tariff news is scariest yet IMHO. Rare earth tariff's will hurt. Hopefully we don't end up climbing out the trap.
 
Pushing elevator buttons will not help if the cable already breaks, as the OP said. :)
 
I am just going to push all the buttons and hope the elevator door opens on the right floor! :D The latest tariff news is scariest yet IMHO. Rare earth tariff's will hurt. Hopefully we don't end up climbing out the trap.

Does not matter what the Chinese/North Koreans/Fed/Potus/My Grandmother do/say/threaten, It is only "market sentiment" that matters. The "higher probability" of this move lower has been baked into the cake for months.
 
Last edited:
Does not matter what the Chinese/North Koreans/Fed/Potus/My Grandmother do/say/threaten, It is only "market sentiment" that matters. This move lower has been baked into the cake for months.

Add 'analyst' to the list :)

Heard one say that there is an 85% chance of the markets moving up after a 3 month decline...based on some historical analysis somewhere. Which means there is a 15% chance it won't...if you listen to analysts :blush:
 
I do not believe the market will be "allowed" to go down...until 2020 elections are over.
 
I sold 3 PUTs yesterday. Are these good strikes and expiry? I am mostly in cash and these puts are cash secured. So I am wondering, if I should sell more PUTs or wait for more fall, to earn more premium? Screenshot_2019-05-29-23-12-40-165_atws.app.jpg
 
I do not believe the market will be "allowed" to go down...until 2020 elections are over.

I actually think the opposite - there's going to be a lot of pressure on this market by those who can do so (the "real" money) to create fear, negate what to now has generally been a perception of a very strong economy (good for the current administration) and to ultimately try to effect change in leadership.

Guess we shall see..but I do think the next 12+ months are going to be a lot more volatile and potentially include some big drops once again (to try to cause a stampede to the exits which once it starts would easily be self-sustaining) than the last 5..in fact, I think it's already started with the fear-mongering about the inverted yield curve, bond market direction, etc. Plus, they're building on the "sell in May and go away" mantra that even your local shoe shine boy knows nowadays. It's almost obvious and I expect it will only get worse the closer we get to election season..
 
Last edited:
I guess we will see in the next few months if the OP is right or not. I do think there is more downside than up for the summer and with the TW heating up.
 
Last week I said this:

"There will be one more push to 2860 area (S&P), then we retest the Dec lows, and then rally back to new highs at about 4,000 before this Bull market is finally over in about 3 years!"

Well the S&P only rallied to 2940, with the trap door (2770) now open, I expect the market to trade down to the 2200 area again. See you all their!:dance:

I am curious just how seriously you bet your portfolio on this view? What percentage do you put at risk on short term calls? If I recall correctly, you have a method that looks at some combo of moving averages.

BTW, my model which is most sensitive to yield curve inversion shows we are getting closer to a sell situation but not there yet.
 
Last edited:
I am curious just how seriously you bet your portfolio on this view? What percentage do you put at risk on short term calls? If I recall correctly, you have a method that looks at some combo of moving averages.

BTW, my model which is most sensitive to yield curve inversion shows we are getting closer to a sell situation but not there yet.

I am currently net 30% short on this view. I would like to be shorter but I do not use margin. I am strictly a technical trader. I use various trading models and my current model does not use MA although I am aware of the 200 day MA right below us, as well as the H&S top pattern we broke through yesterday. To be more specific I believe we are in the third wave of a corrective "C" wave. The A wave off the top we reached last year.
 
Last week I said this:

"There will be one more push to 2860 area (S&P), then we retest the Dec lows, and then rally back to new highs at about 4,000 before this Bull market is finally over in about 3 years!"

Well the S&P only rallied to 2940, with the trap door (2770) now open, I expect the market to trade down to the 2200 area again. See you all their!:dance:

are you going to short sell the market then ?
 
Another round of Tariffs for Mexico .. Dow down 270 points today. I guess more Trade Wars coming
 
D750YZfXkAElbdW.png:large


I think this long term chart on Deutsche Bank indicates a clear buy point on the stock and shows how technical analysis can be so valuable
 
Wow, interesting chart on Deutsche Bank share price!

I do not follow any bank stock, but a fundamental analysis of this bank vs. another that does well like, say, Toronto-Dominion (TD), would be interesting to this ignoramus.

Sorry for the topic drift.
 
D750YZfXkAElbdW.png:large


I think this long term chart on Deutsche Bank indicates a clear buy point on the stock and shows how technical analysis can be so valuable

You need to go back further in time. The signal to go short was on 8/18/2008 at about $98.00 after dropping down from the high of $162. Shorts would have covered years ago (2009) at $25.00. In the past 10 years, there has never been a "buy" signal, only several more opportunities to short!

So, when in your opinion, would "fundamental analysis" have led you to short the stock or buy a put?
 
...

I think this long term chart on Deutsche Bank indicates a clear buy point on the stock and shows how technical analysis can be so valuable

I don't understand - how does this chart show the value of technical analysis? I'm assuming you see the indicated support level as a buy point, but we won't know if that is a good call until sometime later (assuming it even hits that level).

Or were there other buy/sell points you did not point out?

Wait a minute - that 'Major Support Level" is at zero! I predict it won't go below zero! But now I'm more confused - are you saying there is no support, it should be shorted? What technical analysis determined this?

edit - or was that satire that went over my head for a while?

BTW, I have a relative ( ~ 30 YO) that was hired to DB in NY a couple years ago. He survived the last lay offs, I don't know if there are more to come.

-ERD50
 
You need to go back further in time. The signal to go short was on 8/18/2008 at about $98.00 after dropping down from the high of $162. Shorts would have covered years ago (2009) at $25.00. In the past 10 years, there has never been a "buy" signal, only several more opportunities to short!

So, when in your opinion, would "fundamental analysis" have led you to short the stock or buy a put?


Although it may seem like I am mocking the technical analysis I am not, I saw this chart and had to post it somewhere on this forum and this seemed the best thread. I do not short stocks as a usual practice, I do buy puts from time to time, this stock I have been waiting to go to zero since 2009, like Japanese Banks they have so much troubled assets it is just slowly grinding down. But at zero I do believe the downside is negligible. But negative interest rates will eventually rescue everything

D75docBWwAAEwve.png
 
Last edited:
Although it may seem like I am mocking the technical analysis I am not, I saw this chart and had to post it somewhere on this forum and this seemed the best thread. I do not short stocks as a usual practice, I do buy puts from time to time, this stock I have been waiting to go to zero since 2009, like Japanese Banks they have so much troubled assets it is just slowly grinding down. But at zero I do believe the downside is negligible. But negative interest rates will eventually rescue everything

D75docBWwAAEwve.png

No harm no foul!

For anybody else, I covered all shorts today at the close. While the "trap door" is still open, by not breaking below 2750 today, means their feet are dangling through the opening and they are hanging by their fingertips. Will reset my shorts next week hopefully.
 
Back
Top Bottom