Three brothers

Onward

Thinks s/he gets paid by the post
Joined
Jul 1, 2009
Messages
1,934
This illustration was given on Consuelo Mack's Wealthtrack today. I haven't checked the numbers, but it does make one think.

Three brother retire within a six-year time period. Each puts $1,000,000 into an S&P index fund and withdraws $5,000/month. No adjustments for inflation.

Brother 1 retires Jan 1, 1997.

Brother 2 retires three years later, Jan 1, 2000.

Brother 3 retires another three years later, Jan 1, 2003.

Fast forward to mid-2010:

Brothers 1 & 3 have portfolios valued at over $1,000,000 each.

Brother 2's portfolio is under $250,000.
 
There's a subtle flaw here.

The example implies that each brother starts off with the same amount of money. True, they retired with the same amount of money, but they didn't start off with the same amount (remember they retired at different times).

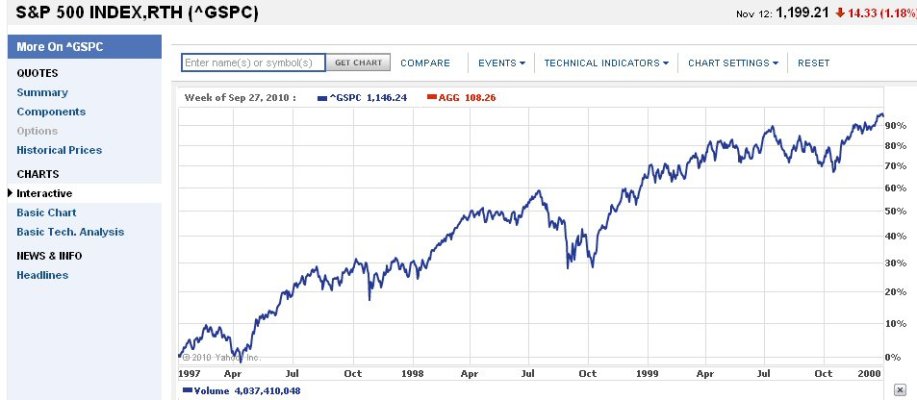
Take brothers 1 and 2. Brother 1 has 1 million on 1/1/1997. How much did brother 2 have on 1/1/1997? Assuming he was investing in the S&P 500, probably only around $500,000 or less.

1997To2000.jpg

When you consider that brother 2 starts with half the money, yet still withdraws at the same rate, the result is less shocking.

Most "don't retire at the start of a downturn" arguments have this same flaw.
 
It makes me think that 6% is not a SWR
In this particular case, 4% doesn't work either.

Raddr's board has been running a thread for over five years on the hapless hypothetical Y2K retiree who began his ER on 1 Jan 2000 with a 75/25 mix of stocks/bonds and a starting 4% SWR + inflation (the Trinity Study SWR). He's continued his fixed-withdrawal plan for over a decade in the face of all evidence to the contrary.

Raddr's Early Retirement and Financial Strategy Board :: View topic - Hypothetical Y2K retiree update

In 2008 his withdrawal rate exceeded 10%, but in 2009 it was "only" 9.2%...

Wow - - that would be frightening. Luckily most of us are at least slightly smarter than rocks, and so we would have re-examined our withdrawal scheme long before it came to double digits. :eek:
 
Wow - - that would be frightening. Luckily most of us are at least slightly smarter than rocks, and so we would have re-examined our withdrawal scheme long before it came to double digits. :eek:
Exactly. Most people would have reacted in some way, and most people are slightly smarter than rocks.
 
Three brother retire within a six-year time period. Each puts $1,000,000 into an S&P index fund and withdraws $5,000/month. No adjustments for inflation.

I think I see the problem. They retired, and invested in a single historically volatile asset class. Could be worse. Could have used QQQQ...

I wonder what would have happened if they had each put 35% in a total stock market fund, 15% in a total international fund, and 50% in a total bond market fund, each with very low expense ratios. Maybe used a safer withdrawal rate than 6%? Anyone? Anyone?
 
...............
I wonder what would have happened if they had each put 35% in a total stock market fund, 15% in a total international fund, and 50% in a total bond market fund, each with very low expense ratios. Maybe used a safer withdrawal rate than 6%? Anyone? Anyone?

Now what fun would that be, when the intent was to scare the he!! out of the reader?
 
It makes sense not to withdraw as much in downturn. SWR too high or not, the difference in the remaining $ between the brothers is kind of frightening!
 
Having been retired for close to 10 years now, it's become quite obvious that setting a SWR amount the day you retire and withdrawing an amount plus CPI for your whole retirement, is quite ridiculous. Every time the market drops, I'm sure most of us calculate a new SWR based on the 'scalped' portfolio. I decided to come up with a formula for what I actually do. I posted this over at Bogleheads also. This is a modification of what others have done, but it works for me. It's simple.

1.) Each year (Jan. 1) Run FireCalc for the Portfolio Balance and Length of your Plan. Let FireCalc compute your Level of Spending for the 'Plan'.
2.) Withdraw that amount from the portfolio and Put Cash in Account S (Surplus)
3.) All Spending comes from Account S.
4.) Subtract 1 year from the Length of your plan and repeat Steps 1-3 each year.
5.) Never let your Length of plan to fall less than 5 years(For unplanned longevity), and use the new Portfolio Balance (Which never includes Account S)


This will insure that if your Portfolio drops, you won't be drawing it down during bad times and that if your portfolio grows, you can spend the extra dough without piling it up at the end. Also by running Fireclac evey year with a reduced plan period will increase the SWR, as well as Market growth.

Yes, if your portfolio drops in half, so will your withdrawals. So if you need this to live on, I would not retire. Make sure you have plenty of luxuries (Things that can be cut, if need be) in your budget.
 
Dory36 shows a similar example of markedly different outcomes for three retirements with the same withdrawal rate beginning in 1973, 1974, and 1975: FIRECalc

Yep. It's unpleasant to think about, but the most important thing I've learned form hundreds of FireCalc runs, many with downloads of the spreadsheets, is that the year you retire will have a dramatic impact on your ending value. Yes, you can make sure you have slack in your budget and excess in your FIRE portfolio so you can cut back in down years. But retiring in the "wrong" year will lead to crappy results for some of us which cannot necessarily be completely overcome by adjusting withdrawal rates. And, the higher your withdrawal rate, the more your specific retirement year will impact your results.

Someone who retires into a dropping market followed by years of high inflation just isn't going to do as well as someone who retired into a rising market followed by years of low inflation. That's why FireCalc terminal values have such large variation depending on the starting year.

But, yes, being able to vary withdrawals significantly will help reduce the variation.........

I guess it's hard to accept that your arbitrary postion on history's timeline can do this to you, but it can........
 
There's a subtle flaw here.

The example implies that each brother starts off with the same amount of money. True, they retired with the same amount of money, but they didn't start off with the same amount (remember they retired at different times).

Take brothers 1 and 2. Brother 1 has 1 million on 1/1/1997. How much did brother 2 have on 1/1/1997? Assuming he was investing in the S&P 500, probably only around $500,000 or less.

View attachment 10446

When you consider that brother 2 starts with half the money, yet still withdraws at the same rate, the result is less shocking.

Most "don't retire at the start of a downturn" arguments have this same flaw.

Exactly. They absolutely did not have the same amount of money in 1997. It's like comparing three very different people, it is NOT like comparing three similar people who happened to retire in different years.

You can also make your point from the other way round, if Brother #2 actually had the same $1M as #1 did in 1997, he would have been fine in 2000, because then he'd have roughly $2M to start his retirement with - not just $1M. He'd probably be fine, he'd have a 3% WR, not 6% like B#1.

I really think this should be be brought out on the FIRECALC intro page.

I think haha has said it another way - it's not the amount of money you have, it is the value of that money.

Yep. It's unpleasant to think about, but the most important thing I've learned form hundreds of FireCalc runs, many with downloads of the spreadsheets, is that the year you retire will have a dramatic impact on your ending value.

True, but the failures are based on those worst years. So if you use a 100% success rate, the SWR already takes that into account (assuming a future no worse than the worst of the past, all we can do is throw in more fudge factor on that).

-ERD50
 
Last edited:
cut-throat, how do you let firecalc calculate the spending level? If I leave the spending input blank I simply get a 100% success rate and a big pile of money at the end of 40 years.....what am I missing?
 
Lisa, go to the "Investigate" tab on FIRECalc.
Under the "Given a success rate, determine spending level for a set portfolio, or portfolio for a set spending level" option, select "Spending level".
Click "submit"
 
Many thanks! I knew it had to be simple. :blush:
 
True, but the failures are based on those worst years. So if you use a 100% success rate, the SWR already takes that into account (assuming a future no worse than the worst of the past, all we can do is throw in more fudge factor on that).

You're confusing all outcomes being successful with all outcomes being the same. Yes, a withdrawal scenario can be backtested against many historical periods and survive them all. But some may have terminal values at or near zero and others have terminal values well above the initial value. That was the point of the article.

Based on comments you've made in other threads, I'm surprised you are equating all trials being successful with all trials having the same terminal value outcome. I'm sure you recall earlier discussions where it was pointed out (I think by you) that some folks will enjoy periods of excellent market performance and low inflation while others will suffer through crappy market performance and high inflation. Properly planned, both can have 100% success rates of their FIRE portfolios, but the unlucky folks will have a scary ride down and probably end near zero. The lucky folks might have a multiple of their original amount at the end. That's what the output graph of the current version of FireCalc shows with each line representing a particular starting year. Frankly, the graphs shown with the previous version of FireCalc did a better job of illustrating the variability since one actually labeled years so you could see, historically, which starting years resulted in a low (but not necessarily a failure) terminal value.

So, are you feeling lucky? Is the chunk of the timeline you're living through going to result in a low, mid or high terminal value? Assume no failures (you don't run out of money). But will you depart our world near broke or wondering why you have so much money?
 
You're confusing all outcomes being successful with all outcomes being the same. Yes, a withdrawal scenario can be backtested against many historical periods and survive them all. But some may have terminal values at or near zero and others have terminal values well above the initial value. That was the point of the article.

True. I was just looking at binary success/failure, which is my biggest concern. If either of us is lucky enough to track one of those top third Terminal Value paths, we'll be starting one of those threads about how to spend all our money!

-ERD50
 
True. I was just looking at binary success/failure, which is my biggest concern. If either of us is lucky enough to track one of those top third Terminal Value paths, we'll be starting one of those threads about how to spend all our money!

-ERD50

Yeah, I'm often guilty of that too. It's easy to do. When you see you're 100% successful, it's easy to jump to the conclusion that your FIRE portfolio is still near its initial real value at the end. Actually that will only happen to a few folks. Most will have terminal values much higher or much lower in real value than what they started with.

You can adjust your AA and your WR as the years go by, but you can't completely eliminate the effects of the market conditions and inflation level you're living through. In fact, your manipulations may make it worse.

It is interesting to note that the three brothers are all having the same result so far in FireCalc terms: They have 100% success rates.
 
It is interesting to note that the three brothers are all having the same result so far in FireCalc terms: They have 100% success rates.

Also true, but the real point I was making was in response to T-Al's analysis, and I think he makes a good point that seems to get overlooked by many. If all three brothers had $1M in 1997, things would not look so different for them down the road, even though they retired at different times. In mid-2010, surely B#2 who retired in 2000 would be ahead of B#1 retiring in 1997 as B#2 was not drawing down as long. Just the opposite of what the story presents.

The 'three brothers' story seems to equate retiring with $1M as "apples-to-apples", but that means they were unequal in 1997, which hardly seems "apples-to-apples". Most people build their wealth over a long time, that $1M didn't just fall in their lap on the day they retired. It ignores what led up to having that $1M at that date. So a more relevant scenario is that they had close to the same amount in 1997 (maybe separated by 6 years of saving/investing).

The story still provides a valuable lesson. $1M at the top of a peak is not worth as much as $1M in a trough. I just take some exception to the implication that these are three similar scenarios. For a fuller lesson, they should present both cases, IMO.

-ERD50
 
It is a simple illustration about the timing of the purchase of the S&P 500 index (the relative mark to market of the value of securities in the portfolio at different times), beginning to draw-down (when the market is up or down), and the effect on the the draw-down on the portfolio value. Many people are not familiar with all of the details... they just see the % rule of thumb.

Those 3 examples illustrated taking $1M and buying the S&P index at the bottom (of a bear market) versus the top (of a bull market).

This has been discussed in this forum.... stress on a portfolio of stock is greater if withdrawals begin right at the top of a market peak as opposed to the bottom of a trough. 4% of $1M is $40k. If the $1m is cut in half the following year... it is now 8+% of the portfolio... several years of 8+% withdrawals will take its toll.

IMO - if this happened to someone, they need to consider a reset. Conversely... if one is retiring while a bull is long in the tooth... they may consider a smaller WR% to do a sanity check to see if the portfolio can fund the retirement. However, at the trough, one should not consider the safe WR% (for a specific number of years) to fund future income.

One should do a health checkup yearly on the state of their portfolio of (stock/bonds), the market, economic conditions, their personal situation... to determine if the portfolio can continue to support the income level.

Still, most people would recoil in fear after seeing their portfolio cut in half. I think many would reduce spending out of fear.

I believe using a constant mix to fund retirement is risky. I prefer some form of a bucket approach. I think one of the most important things that people overlook is:

Managing one's securities should be handled differently during accumulation vs approaching decumulation (transition) vs decumulation.
 
In 2008 his withdrawal rate exceeded 10%, but in 2009 it was "only" 9.2%...

Those numbers actually make me feel pretty good.

Consider: He retired at the very end of an equity bubble where the S&P 500 P/E reached over 40x, with a 75% equity allocation, followed by an immediate recession, then the Great Recession, and after all of that, he may still get two decades out of his portfolio.

Yes, and not to mention a 6% WR! The conservative people here are shooting for closer to 3% - that might make a teensy difference over a few decades.

-ERD50
 
... but it does make one think.


Fast forward to mid-2010:

Brothers 1 & 3 have portfolios valued at over $1,000,000 each.

Brother 2's portfolio is under $250,000.

Are you thinking about market timing?
 
Back
Top Bottom