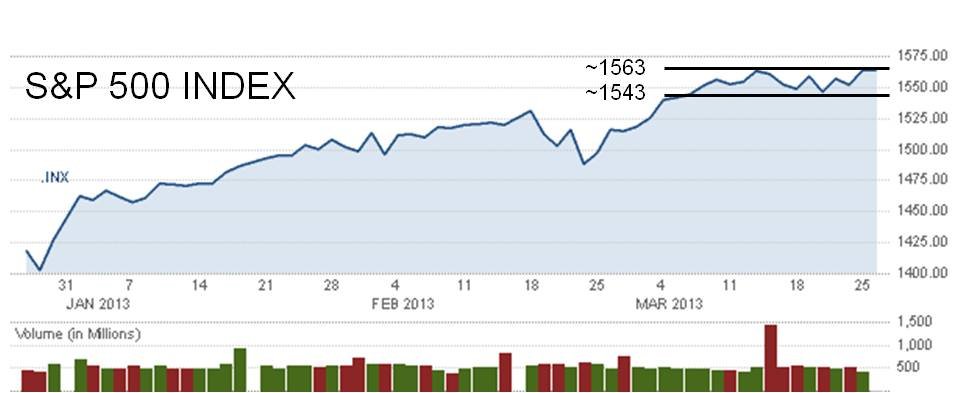
I've been noticing that between ~11/15/12 and ~3/7/13, the S&P 500 has been in a mostly upward trend. Now, since ~3/7/12 (the past ~3 weeks), it seems to be whipsawing within a fairly(?) narrow range between ~1543 and ~1563 (graph attached).
All I can make of this (gut feeling) is that the markets are uncertain, but I don't have the experience to know if there's anything more that can be gleaned.
Do any of the more experienced folks here make anything of this beyond being "just a blip", e.g. does such a phenomenon have any historical significance? Historically, has this kind of thing preceded a further advance or decline? What about the increased (>double) volume on 3/15/13? Appreciate any insights.
Tyro
Attachments
Last edited:
 This has been the smoothest sailing I can remember in quite some time, feels like the good ship lollypop