NW-Bound
Give me a museum and I'll fill it. (Picasso) Give me a forum ...
- Joined
- Jul 3, 2008
- Messages
- 35,712
I was inspired by a concurrent thread by Haha, where he asked whether any of us has seen his/her portfolio going below its starting point.
See: http://www.early-retirement.org/for...-portfolio-decrease-since-retiring-69887.html
In the above thread, I contributed a link to a site where it was shown that a Y2K retiree with a portfolio of 75% equity and 25% 6-month commercial paper would be in deep trouble. By Jan 2013 his portfolio is already down to 36% in real terms. I was not the first to post a link to that table; in fact, I learned about it from earlier posts by several posters on this forum.
The 36% final value after 13 years of retirement looks bleak. However, raddr, the author of that table used a portfolio of high equity AA of 75%, plus a 4% WR. So, I wondered if the above could have compounded the effects of the "Lost Decade" in stocks.
I am glad I still had part-time income from 2000 till 2012, so I did fairly well financially. But to satisfy my own curiosity about the fate of earlier retirees, I've got to check further on my own. And FIRECalc is the natural tool to use here. And as I already collected the run results, I might as well share them here as a community service.
To aid anybody who wants to double check the results, here is what I did. I set FIRECalc to $1M initial portfolio, and for 12-year runs. In the "Investigate" tab, I chose to download a single-run result spreadsheet starting with the year 2000. If I set the run duration for 13 years, FIRECalc would back off the initial year to 1999. Apparently, FIRECalc only has data up to the end of 2011 (start of 2000 to end of 2011 encompasses 12 years).
On the portfolio tab, for the simple stock/bond portfolio, FIRECalc offers the following fixed income (FI) options: commercial paper, long-term rate, 30-yr Treasury, and 5-yr Treasury. I ran them all. For each choice of FI asset, I ran a mix with 60%, 50%, 40%, and 0% total equity market, with total market being the only choice here for equity. I believe the Total US Market index is fairly close to the S&P 500. The expense ratio was left at the default 0.18%.
The results are shown below for $1M initial portfolio in 1/2000, and a WR of 4% with COLA.
Observations:
So, balanced portfolios did not do well during the "Lost Decade" for stocks. We already knew that stock return was flat over this period of 2000-2012, even with dividends. What I found surprising was that rebalancing did not help that much, as the best one could do was holding no equity at all.
Now, knowing after the fact that 100% 30-yr Treasury was best, I wondered what happened if the unlucky retiree cut back on his WR. Following is the result showing effects of various WR rates.
A cut back of WR by 25% from 4% to 3% helps the final value by 19% ($715K to $815K).
Final Observation:
As I explained, FIRECalc only lets me get to Jan 2012. Since then, the market has rallied, and 30-yr Treasury has dropped -14% in 2013, using VUSTX as a surrogate. This would equalize the results in the table somewhat, but I think our 50/50 indexed balanced-portfolio retiree is still sweating.
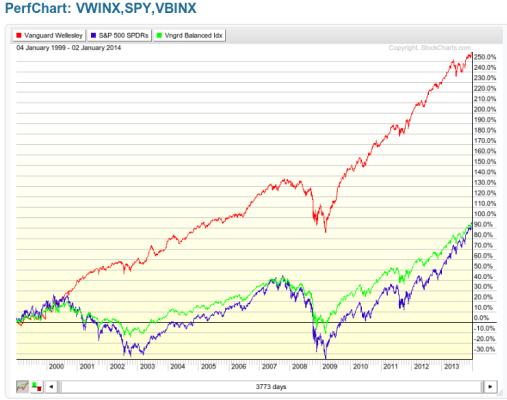
People in some active funds like Wellesley or Wellington might do better, thanks to the skill of the fund managers. I might do a follow-up on that.
See: http://www.early-retirement.org/for...-portfolio-decrease-since-retiring-69887.html
In the above thread, I contributed a link to a site where it was shown that a Y2K retiree with a portfolio of 75% equity and 25% 6-month commercial paper would be in deep trouble. By Jan 2013 his portfolio is already down to 36% in real terms. I was not the first to post a link to that table; in fact, I learned about it from earlier posts by several posters on this forum.
The 36% final value after 13 years of retirement looks bleak. However, raddr, the author of that table used a portfolio of high equity AA of 75%, plus a 4% WR. So, I wondered if the above could have compounded the effects of the "Lost Decade" in stocks.
I am glad I still had part-time income from 2000 till 2012, so I did fairly well financially. But to satisfy my own curiosity about the fate of earlier retirees, I've got to check further on my own. And FIRECalc is the natural tool to use here. And as I already collected the run results, I might as well share them here as a community service.
To aid anybody who wants to double check the results, here is what I did. I set FIRECalc to $1M initial portfolio, and for 12-year runs. In the "Investigate" tab, I chose to download a single-run result spreadsheet starting with the year 2000. If I set the run duration for 13 years, FIRECalc would back off the initial year to 1999. Apparently, FIRECalc only has data up to the end of 2011 (start of 2000 to end of 2011 encompasses 12 years).
On the portfolio tab, for the simple stock/bond portfolio, FIRECalc offers the following fixed income (FI) options: commercial paper, long-term rate, 30-yr Treasury, and 5-yr Treasury. I ran them all. For each choice of FI asset, I ran a mix with 60%, 50%, 40%, and 0% total equity market, with total market being the only choice here for equity. I believe the Total US Market index is fairly close to the S&P 500. The expense ratio was left at the default 0.18%.
The results are shown below for $1M initial portfolio in 1/2000, and a WR of 4% with COLA.
| Commercial Paper + | Ending Nominal Val (1/2012) | Ending Infl. Adj. Value |
| 100% equity | 404K | 300K |
| 60% equity | 525K | 391K |
| 50% equity | 545K | 406K |
| 40% equity | 561K | 418K |
| 0% equity | 583K | 434K |
| Long Int. Rate + | Ending Nominal Val (1/2012) | Ending Infl. Adj. Value |
| 100% equity | 404K | 300K |
| 60% equity | 638K | 475K |
| 50% equity | 692K | 515K |
| 40% equity | 742K | 553K |
| 0% equity | 907K | 675K |
| 30-Yr Treasury + | Ending Nominal Val (1/2012) | Ending Infl. Adj. Value |
| 100% equity | 404K | 300K |
| 60% equity | 655K | 488K |
| 50% equity | 714K | 532K |
| 40% equity | 771K | 574K |
| 0% equity | 960K | 715K |
| 5-Yr Treasury + | Ending Nominal Val (1/2012) | Ending Infl. Adj. Value |
| 100% equity | 404K | 300K |
| 60% equity | 612K | 456K |
| 50% equity | 657K | 489K |
| 40% equity | 699K | 521K |
| 0% equity | 825K | 614K |
Observations:
- The 60% commercial paper + 40% equity portfolio ended with $391K. This is close to the 75/25 raddr case, which ended with $360K one year later in Jan 2013.
- The 100% equity case is just terrible, with $300K final value.
- The more equity, the worse the final value. That is true no matter what you choose for FI. They do not call the recent years the "Lost Decade" for nothing.
- The best case is the portfolio with 100% 30-yr treasury. It ended with the portfolio nearly intact in nominal terms, but a bit above $700K in real terms. That is a lot better than the balanced portfolio with 50% equity mixed in.
So, balanced portfolios did not do well during the "Lost Decade" for stocks. We already knew that stock return was flat over this period of 2000-2012, even with dividends. What I found surprising was that rebalancing did not help that much, as the best one could do was holding no equity at all.
Now, knowing after the fact that 100% 30-yr Treasury was best, I wondered what happened if the unlucky retiree cut back on his WR. Following is the result showing effects of various WR rates.
| 100% 30-Yr Treasury | Ending Nominal Val (1/2012) | Ending Infl. Adj. Value |
| 0.0% WR | 1690K | 1258K |
| 3.0% WR + COLA | 1143K | 851K |
| 3.5% WR + COLA | 1052K | 783K |
| 4.0% WR + COLA | 960K | 715K |
A cut back of WR by 25% from 4% to 3% helps the final value by 19% ($715K to $815K).
Final Observation:
As I explained, FIRECalc only lets me get to Jan 2012. Since then, the market has rallied, and 30-yr Treasury has dropped -14% in 2013, using VUSTX as a surrogate. This would equalize the results in the table somewhat, but I think our 50/50 indexed balanced-portfolio retiree is still sweating.
People in some active funds like Wellesley or Wellington might do better, thanks to the skill of the fund managers. I might do a follow-up on that.
Last edited:

")