I was playing around with Firecalc a few months ago and again today.
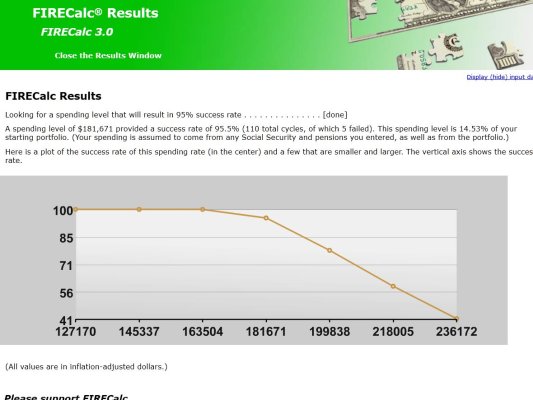
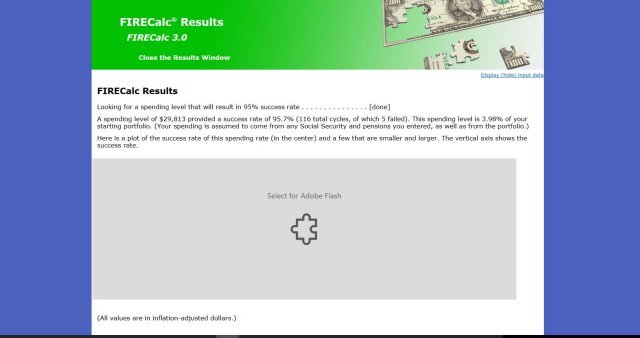
When using the "Investigate" tab to find a spending level with a 95% success rate, I got this output below. (This is based on fake input numbers, btw.)
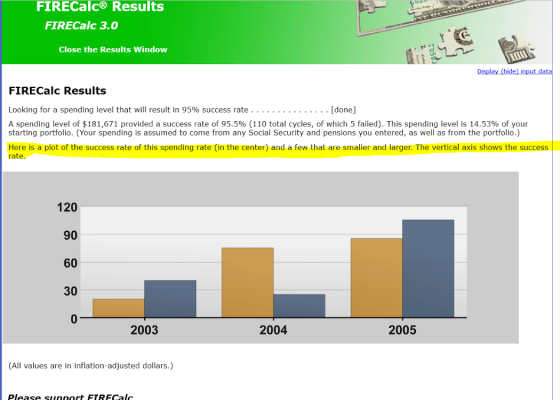
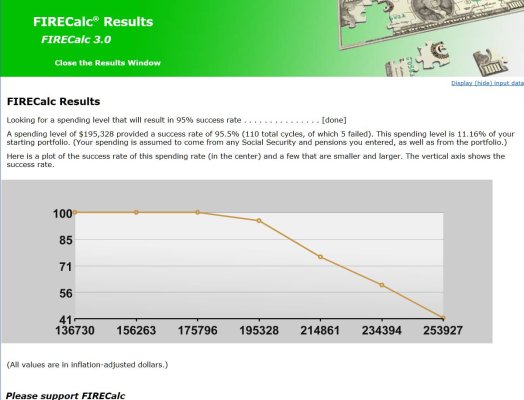
This is a "plot of the success rate of this spending rate (in the center), and a few that are smaller and larger" and "The vertical axis shows the success.". I can't figure out this chart.
Can someone please clarify this for me?
omni
When using the "Investigate" tab to find a spending level with a 95% success rate, I got this output below. (This is based on fake input numbers, btw.)
This is a "plot of the success rate of this spending rate (in the center), and a few that are smaller and larger" and "The vertical axis shows the success.". I can't figure out this chart.
- I have no idea what the gold and gray bars are supposed to represent.
- There's no label on the vertical axis (percentages, possibly?). I do not see any correlation to the 95% success rate of $181.6K in the verbiage portion.
- The horizontal axis appears to be years...(but what is the particular significance of years 2003, 2004, and 2005?)
Can someone please clarify this for me?
omni
Save
SaveSave
Save
Save
SaveSave
Save
Save

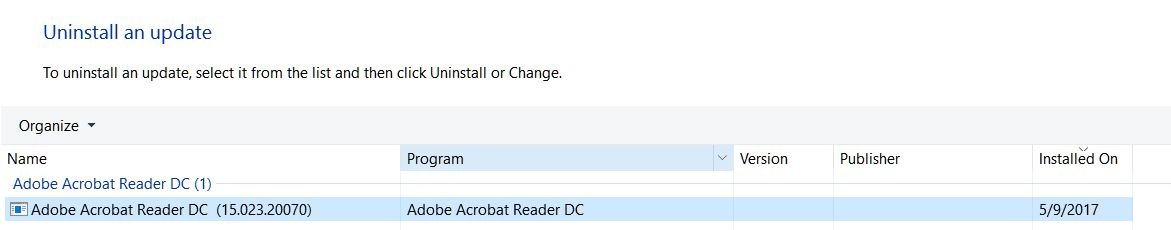
 ...updating Adobe Flash is what was required.