I don't see a cause and effect or even a reliable sell / buy indicator. Like most forms of technical analysis you can use it to clearly explain what happened.
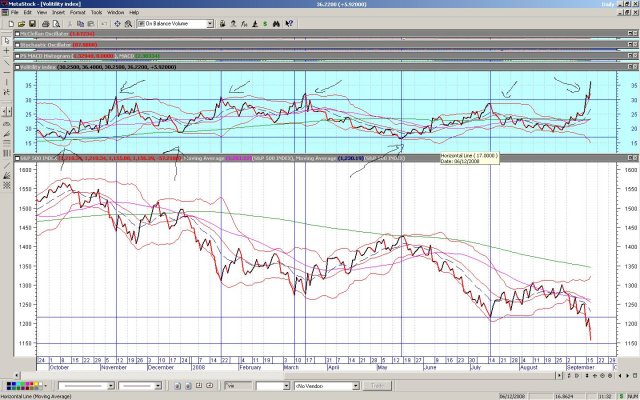
1. Spiking - VIX in a range in between 17 and 30 - The VIX is used to show extreme levels of fear (bottom) and complacency (top) in the market.
In this range is where the greatest amount of uncertainty is.
2 .- long period of time - It is used to show the trend
- Below 17 - market generally up
(from 2004 to half of 2007)
- Above 30 - market generally down
So once you determine the situation you can then determine the investment climate.
No one said it gives you a definitive buy/sell signal.
So if you were to use it for investing a simple plan would be:
Out or No investment - 17 - 30 - Watch for extremes to give you a market direction watch signal.
Buy - VIX at 16.5 and past points trending down
Sell - VIX 17.5 and past points trending up
No system will give you exact high/low, sell/buy points. But a good it would help you mitigate losses (and of course profit)
PS - the traditional lower number was 20 - I used 17 here since that was on the chart I had & I wanted to show the lower extreme and how to use it. I would suggest the 20 - 30 range is better.
")