FIRECALC & WR's

Midpack

Give me a museum and I'll fill it. (Picasso) Give me a forum ...
Joined
Jan 21, 2008
Messages
21,352
Location
NC
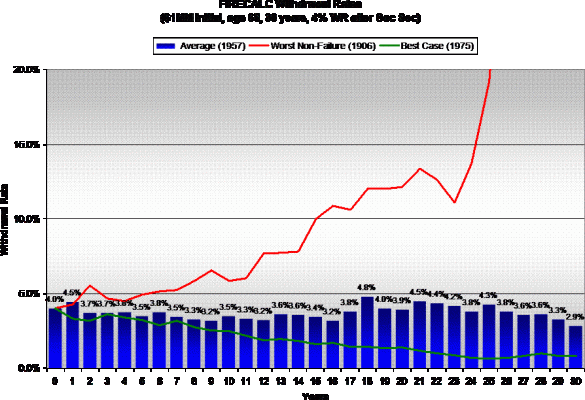
Just for fun, I did a classic 4% SWR age 65 scenario to show what year to year withdrawal % would actually be for average, best case and worst case. Illustrates how wildly results can vary if a retiree were to just blindly follow the 4% rule without regard to asset balances (not that anyone would) - and how pinning down a bulletproof number in advance is out of the question. I was just curious to see the result in this format, thought maybe others might...

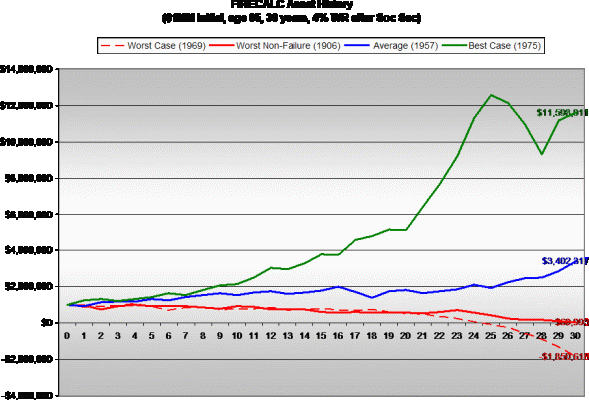
First chart is withdrawal rates for each year (expenses inflated by 3% each year) starting with 4% SWR and following the classic withdrawal methodology. Second chart is corresponding asset balances, same chart as FIRECALC provides except only showing 4 cases instead of all.

The point is not to examine the results, as much as comparing best, worst and average cases.

Assumptions:
Retired age 65
Plan duration 30 years (age 95)
Nest egg $1MM
Expenses $60K/yr initial ($40K withdrawal, $20K Soc Sec starting age 65)
Inflation 3%
FIRECALC probability of success 94.6%
Default asset allocation & returns
 

Attachments

  • WR.gif
    WR.gif
    31 KB · Views: 77
  • Assets.gif
    Assets.gif
    29.3 KB · Views: 67
Just curious here (don't want to set off a storm)... but I'm wondering how much faith folks here put into Firecalc.

I find it to be a fantastic tool and it confirms the results of other calculators, but some posters seem to take the results as 'gospel'. Sort of "well, I ran my inputs through Firecalc and it says that I'm good, so I'm on my way!..."

To me, it is a guide that tells me if I'm in the ballpark or out in the weeds. When a calculator tells me that in 30 years I could have between a $400K or $14,000,000 balance, there has to be a lot of room for error. No?

I would NEVER take results from any retirement calculator as gospel. Even though I think FIRECalc is one of the better ones available, I only regard it as a double check. If FIRECalc didn't give me a good result, it would be a huge red flag for me, in other words. FIRECalc is a bit optimistic for my tastes (but then, I tend to be pretty cautious).

I always recommend running one's scenario through FIRECalc as a doublecheck, but I don't think that is all there is to retirement planning.
 
Just curious here (don't want to set off a storm)... but I'm wondering how much faith folks here put into Firecalc.

I find it to be a fantastic tool and it confirms the results of other calculators, but some posters seem to take the results as 'gospel'. Sort of "well, I ran my inputs through Firecalc and it says that I'm good, so I'm on my way!..."

To me, it is a guide that tells me if I'm in the ballpark or out in the weeds. When a calculator tells me that in 30 years I could have between a $400K or $14,000,000 balance, there has to be a lot of room for error. No?
I'd suggest you start a thread to explore that question. That's not what this thread was for at all...
 
I'd suggest you start a thread to explore that question. That's not what this thread was for at all...

Ok. Sorry. I've always had a problem with tangent control.
 
Midpack - I'm not clear on what you want to explore. Yes, the two Firecalc charts present the data in different ways, but I would draw equivalent conclusions from each. Should that not be the case?
 
Midpack - I'm not clear on what you want to explore. Yes, the two Firecalc charts present the data in different ways, but I would draw equivalent conclusions from each. Should that not be the case?
Not meant to be a revelation. Just two ways of looking at the same thing as you say. I think everyone knows how wildly different assets would grow for best and worst case, or residual $ after 30 years.

Viewing same as actual withdrawals for each year following the 4% SWR methodology is easier relate to IMO, that's why I did it. Imagine withdrawing at more than 10% yr after yr for the last half of retirement - and not running out of money as the worst case shows. Who would have the nerve, not me, even though you'd have a 95% chance of success based on past history. OTOH, imagine withdrawing less than 1% for many years, while still building a considerable nest egg, with no need to reduce spending at any time. Just puts the huge divergence in potential outcomes in perspective more clearly for me. Maybe I'm the only one. Luck of the draw is an understatement IMO.

And again, I realize no one would mindlessly follow the 4% SWR methodology without regard for outcomes as they develop.
 
Last edited:
To me it just reinforces that flexibility is a key aspect of retirement and being able to dial down expenses if investment results lag is important.
 
...(snip)...
Assumptions:
Retired age 65
Plan duration 30 years (age 95)
Nest egg $1MM
Expenses $60K/yr initial ($40K withdrawal, $20K Soc Sec starting age 65)
Inflation 3%
FIRECALC probability of success 94.6%
Default asset allocation & returns
Here are a few questions about the inputs that I've wondered about for my own case:

1) Assuming our retiree owns his house (no mortgage), wouldn't a good plan B be to assume he could sell at 85, then rent and live on the balance + SS? In that case, couldn't he just run the simulation for 20 years and assume that it's pretty much worst case?

2) Before 1930 the stock market allowed extreme equity leveraging by individuals. Today that is not done much and probably not by most retirees. So I've always run my simulations starting around 1925 but payed particular attention to the "retire in 1968" line which I think is close to worst case for current history. I noticed the worst case in OP's simulation was 1906 (I think) -- maybe just too long ago to realistically take into account with current economics? This is probably a very debatable point but just thought I'd mention it.

3) When I run FIRECalc I use the CPI inflation rate. Did the above just use a straight 3.0%? If so I think it is too optimistic. Post WW2 inflation was high as was the 1970's.
 
Last edited:
When a calculator tells me that in 30 years I could have between a $400K or $14,000,000 balance, there has to be a lot of room for error. No?
The philosophy behind Firecalc is clearly stated on the main page. Anyone who would expect such a tool to provide a very narrow range of specific outcomes needs to do a bit more reading.
 
I find it interesting that the worst-case and best-case scenarios start only 6 years apart: worst - 1969, best - 1975.
 
Firecalc, is kind of like a GPS, good for general directions, in general, but you still need to exercise some common sense.

Can I get an Amen ?
 
A m e n !
 
I like the Firecalc a lot in that it shows the variability we all (should) know about. I'm new here but not to these calculators. I've used the Fidelity one, and what I like about it is that it accounts for what is yet to be taxed (IRA's etc) as well as state taxes and gives you a detailed cash flow based on their worst case. Yes, you can see what would happen in 9/10, 3/4, and 1/2 scenarios, but the Firecalc gives you a more graphic view of the spread.

I think what the spread the firecalc shows is that the first few years (well, if you're retiring really young more than first few) you better be willing to be flexible. I wouldn't want to have it figured to the nearest $100 a month and go into what we went into in 2008.

Anyway, good board, like all the thoughts here.
 
I've run my numbers throught FireCalc, Fido, Vanguard and my own homegrown spreadsheet. I like to "compare and contrast". I'm starting to get some consensus (worst plan has my portfolio depleted in 30 years, age 80, best has me depleted in 38 years). My conclusion is that my portfolio will be depleted somewhere in between. As long as my SS will cover roof and food at age 80 then I'm ok with ER. (BTW - when I talk about SS I assume no future earning and only a 65% payout on the number I get from the SSA website).
 
Any thoughts on my questions above particularly question #1?

Repeated here:
1) Assuming our retiree owns his house (no mortgage), wouldn't a good Plan B be to assume he could sell at 85, then rent and live on the balance + SS? In that case, couldn't he just run the simulation for 20 years and assume that it's pretty much worst case?
Or alternately, as that lower red line on the original chart showed poor results at year 20, couldn't the retiree just sell the house and rent to increase their disposable income? I'm assuming the house has some pretty decent market value and has been maintained and is in a decent local.
 
Any thoughts on my questions above particularly question #1?

Repeated here:

1) Assuming our retiree owns his house (no mortgage), wouldn't a good Plan B be to assume he could sell at 85, then rent and live on the balance + SS? In that case, couldn't he just run the simulation for 20 years and assume that it's pretty much worst case?

Or alternately, as that lower red line on the original chart showed poor results at year 20, couldn't the retiree just sell the house and rent to increase their disposable income? I'm assuming the house has some pretty decent market value and has been maintained and is in a decent local.

That seems like a viable option to me. Around here you can get a very nice 2 bed, 2 bath, luxury apartment for $1,000/month, and that includes all maintenance, property tax, property insurance etc.

I actually know a lady who did exactly that at age 70. Last visited with her in January 2010 just before we moved away. She was then 79, and said that it has worked out fantastically well for her.
 
Any thoughts on my questions above particularly question #1?

Repeated here:
Or alternately, as that lower red line on the original chart showed poor results at year 20, couldn't the retiree just sell the house and rent to increase their disposable income? I'm assuming the house has some pretty decent market value and has been maintained and is in a decent local.

Any asset that could come into play, and certainly a house would be one, at age 80 would be helpful. We've had a number of discussions here on the pros and cons, benefits and pitfalls, of including the value of your primary residence in FireCalc numbers. I think that as long as you're willing to give up ownership status of your primary residence and live off the proceeds, there's no reason to not plan on doing so.

My MIL currently lives off of SS and a reverse mortgage on her condo. She's a long time widow and previous stay at home mom who retired at 65 with marginal resources. The reverse mortgage is an expensive way to get at the equity value of the condo but was much less of a hassle for her (now age 85) than selling and moving to an apartment. Well worth it and a viable option to selling and renting.
 
Last edited:
Thanks Alan & Youbet for the replies on the "sell the house" Plan B option. We have a big home in a very well thought of location and really enjoy it. No plans to move. But should we not be able to afford a lot of servicing as we grown older or should it become a burden (financial and/or physical) it seems that Plan B will work fine.

DW used to say she wanted to live by the ocean. I'd always point out the difficulty of getting back to the city for shopping and for good medical care. She would sigh and just dream on. Now some artist friends of hers have moved to a retirement oriented community. She's now mentioning that as a Plan B in the distant future. Never thought I'd see the day. :)
 
More input for Lsbcal's question.

I probably *will* sell the house at age 85, if not before. However, my house is only worth about 12%-14% of my portfolio value. My portfolio has gained more than that in the past year. So, the extra cash will not be that helpful. Besides, at that point I may want to go to a continual care facility and some of them require a "buy in", so it is possible that that money may go to that. If not, I guess I will want to buy a very low maintenance condo in an over-55 building.

To me, renting is not desirable when over age 85 or so because of the difficulty, in fact near impossibility of moving by myself should that become necessary. By 85 I want to be someplace where I can stay for the duration. My present house would work for that and is just 1-2 miles from the best hospital in the area, but the advantage of a continual care facility would be the ease of getting extra assistance, nutritious meals, and so on.

As far as the original topic goes - - Midpack, those are neat graphs! I agree, it's amazing to see how different the outcome can be for just one retirement scenario. I guess that as retirement progresses, one may be able to get a sense of how things are going and could "fudge" a little on the withdrawals if one's portfolio balance has skyrocketed for the first fifteen years or so. I notice that if one's portfolio is doing wonderfully in the third year of retirement (where I am), it is not necessarily very meaningful, though. It takes a decade (give or take a few years) for the "best case" line to really break away from the "average" line in your second graph.
 
Last edited:
Just in case it got lost in the further discussion, my questions were really designed to probe Midpack's red line scenario that ran out of money. I was thinking that running a 30 year plan for many (but not all retirees) who are 65 is ignoring the real estate asset's place in the picture. For us our house is about 35% of net worth (house + liquid assets, ignoring SS).
 
Back
Top Bottom