FIRECalc and the Hapless Y2K Retiree

I was a big D&C fan until it fell prey to the lure of financial stocks in the run up to 2008. I recall it took a beating compared to the two Vanguard funds.
They recovered. And a banner 2013.
 
ezbacktest is a nice tool to backtest a fund portfolio.

Free Download: EzBackTest

Here's VFINX+VUSTX (40/60), it looks similar to VWINX
 

Attachments

  • vfinx-vustx.jpg
    vfinx-vustx.jpg
    41.2 KB · Views: 9
NW I am not sure if you are aware (I wasn't until today) that Raddr 25% fixed income allocation is not the default Long commercial interest rates by rather 90 day T-bills.

This makes the Y2K retiree portfolio look worse than I suspect it was for everybody.
 
NW, great information. Whatever the results during the 'lost decades' my big takeaway is that the market falls off the cliff about every 35 years. That means, on average, we should be good for at least the next 16 - 21 years - until about 2030 - 2035. Woohoo!😄😄😄

I will definitely take your advice and adjust my port by then!
 
ezbacktest is a nice tool to backtest a fund portfolio.

Free Download: EzBackTest

Here's VFINX+VUSTX (40/60), it looks similar to VWINX

Darn! It would have saved me a lot of work. But I am still glad I went through the exercise because I found a thing about FIRECalc that I did not know.

NW I am not sure if you are aware (I wasn't until today) that Raddr 25% fixed income allocation is not the default Long commercial interest rates by rather 90 day T-bills.

This makes the Y2K retiree portfolio look worse than I suspect it was for everybody.

When I ran FIRECalc with all 4 fixed income options, I noted that the Commercial paper (short-term apparently) gave the poorest result, and it was reasonably close to Raddr's numbers.

Later, when I looked at FIRECalc result with 50% long treasury + 50% S&P, it bothered me that it looked worse than one would expect, just by eyeballing VUSTX + VFIAX.

Anyway, I have found the reason for discrepancy. Please stay tuned.
 
Darn! It would have saved me a lot of work. But I am still glad I went through the exercise because I found a thing about FIRECalc that I did not know.

Anyway, I have found the reason for discrepancy. Please stay tuned.

Your exercise will enlighten all of us.
 
So, using the return and inflation data that I posted above, I used a spreadsheet to look at the performance of a retiree who retired right on Jan 2000, who withdrew 4%WR with COLA.

Our retiree would withdraw his COLA'd WR at the beginning of the year. He also rebalanced on Jan 1st.

I was able to run up to the end of 2013 with the following portfolio options.

100% Long-term Treas.
100% Total US Stock
100% S&P Index
100% Wellesley
100% Wellington
50/50 Blend of Total Stock & Long-term Treas
50/50 Blend of SP & Long-term Treas
75/25 Blend of Total Stock & Long-term Treas

All amounts are nominal dollars.
100%​
100%​
100%​
100%​
100%​
50/50​
50/50​
75/25​
Year End
Cumul. Infl.​
COLA WR​
VUSTX​
VTSAX​
VFIAX​
VWIAX​
VWENX​
VTSAX/VUSTX​
VFIAX/VUSTX​
VTSAX/VUSTX​
2000
3.38​
40.00​
1,149​
873​
873​
1,115​
1,060​
1,011​
1,011​
942​
2001
6.31​
41.35​
1,156​
741​
732​
1,153​
1,061​
938​
932​
837​
2002
8.00​
42.52​
1,299​
552​
537​
1,163​
949​
876​
865​
703​
2003
10.45​
43.20​
1,289​
669​
634​
1,229​
1,095​
975​
950​
819​
2004
13.41​
44.18​
1,333​
704​
654​
1,277​
1,170​
1,023​
988​
862​
2005
17.25​
45.36​
1,373​
698​
638​
1,275​
1,204​
1,039​
996​
868​
2006
21.05​
46.90​
1,349​
753​
684​
1,368​
1,331​
1,079​
1,032​
920​
2007
24.50​
48.42​
1,421​
744​
670​
1,396​
1,392​
1,106​
1,056​
929​
2008
29.29​
49.80​
1,680​
437​
391​
1,214​
1,043​
980​
934​
684​
2009
28.85​
51.72​
1,432​
497​
430​
1,350​
1,213​
1,006​
946​
751​
2010
30.97​
51.54​
1,504​
522​
435​
1,437​
1,290​
1,080​
1,002​
805​
2011
35.11​
52.39​
1,877​
475​
391​
1,520​
1,287​
1,183​
1,099​
814​
2012
37.90​
54.04​
1,886​
490​
390​
1,614​
1,389​
1,241​
1,146​
860​
2013
39.90​
55.16​
1,592​
580​
444​
1,708​
1,597​
1,308​
1,196​
981​


Observations:

  • Total Market was better than S&P, either in 100% equity or blended with Treasuries.
  • Wellesley was slightly better than Wellington, but that's because the last decade was the decade of bonds.
  • Both Wellesley and Wellington beat the 50/50 blend of Total Stock and 30-yr Treas. However, the latter does not look as bad as FIRECalc showed.
  • Cumulative inflation was 40%! Wellesley and Wellington kept up with it, but the passive balanced investor did not. Starting with $1M in Jan 2000, you must have $1.4M now to keep up with inflation.

But here's the most interesting point. At the end of 2011, FIRECalc shows that the 50/50 blend of Total Stock/Long Treas portfolio balance would be $714K in nominal dollars (see earlier post), while my spreadsheet shows $1183K. That's a big difference!

The answer to the $469K question is next.
 
Last edited:
I sure do like how Wellington and Wellesley look! Thanks so much for working on this.
 
NW, great information. Whatever the results during the 'lost decades' my big takeaway is that the market falls off the cliff about every 35 years. That means, on average, we should be good for at least the next 16 - 21 years - until about 2030 - 2035. Woohoo!������

I will definitely take your advice and adjust my port by then!

Well, I am not sure if we can ever time anything so well. Sorry, but I did not imply anything about how the future will hold. This has been just an exercise to look back at the last 14 years, where we had two bad recessions, to see how different hypothetical portfolios would perform.

I think the lesson I myself took from this is that a balance approach is still the safest. And that some long-tenured MFs such as Wellesley and Wellington did manage to beat a passive index investor.

Well, I cannot help thinking that a index investor who could and would rebalance at an opportunistic moment, instead of my robotic spreasheet that does it on Jan 1st, would be able to match Wellesley or Wellington.

Additionally, it has been known that a mid-cap and value tilt would let one pick up a little bit more. This has been reconfirmed when we see how Total Market with the small and mid-caps beats S&P which is all large-cap.

PS. The 4% WR with COLA is still possible. Long live the 4%!

PPS. I am going to stick with 3.5% however. I want to make sure my portfolio will grow, even ever so slowly.
 
Last edited:
The numbers shown by NW help make the case for (SPIA) annuitizing a portion of your nest egg to (along with SS) provide a base living income.

The remaining nest egg can then be depleted using a variable withdrawal schemes.

Imagine the outcome back in Y2K with bond yields what they are now.
 
...
But here's the most interesting point. At the end of 2011, FIRECalc shows that the 50/50 blend of Total Stock/Long Treas portfolio balance would be $714K in nominal dollars (see earlier post), while my spreadsheet shows $1183K. That's a big difference!

The answer to the $469K question is next.

Here's the thing I've found with FIRECalc.

When I started this thread, I was simply looking to explore further the unfortunate fate of our "Hapless Y2K Retiree" as Raddr first exposed the situation on his site. As Raddr used short-term commercial paper for the bond portion, and then only 25% at that, I was curious to see how a bit more fixed income and those of a different type would help. And I used FIRECalc for the results shown in the beginning of the thread. It was simply bleak, bleak, bleak...

And as people implored me to look at Wellesley/Wellington, as these balanced funds have often been touted as good and safe MFs for "Norwegian widows", I wanted to see for myself too. And when I happened to look at VUSTX, an MF most fit to represent long-term Treasuries, I was bothered that its performance appeared to be better than FIRECalc showed.

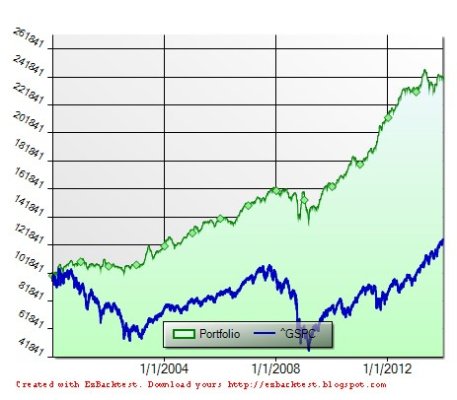
And my own spreadsheet result as posted above shows that a 50/50 Total Stock/Long Treas. did not do bad at all, compared to FIRECalc result.

I examined the spreadsheet downloaded from FIRECalc and saw the following. FIRECalc only applies the income or dividend of the bonds to its growth. FIRECalc does not consider the appreciation of the principal when the interest drops, and the bond yield follows it.

So, the bond portion, at least for the 30-yr treasury option, does not follow the market value as one sees with VUSTX. Because the bond is undervalued in FIRECalc, it does not provide enough "oomph" to help the lousy stock return. Rebalancing also does not help as much, because it does not have one outperforming half to sell high, in order to buy low with the other underperforming half.

How the above effect impacts the simulation results going way back prior to 2000, I do not know. But for the years 2000-2012, the lousy stock return should be cancelled out by the bond gain, and our hapless Y2K retiree would do a lot better if he had some more long bonds in his portfolio, and his long bond is marked to market.

PS. I had very little long bond and still did well, but that's a story for another post.
 
Last edited:
Great sleuthing. Thanks.
 
Great sleuthing. Thanks.
+1

So this means for a portfolio which includes bonds, FIRECalc is showing a higher failure rate than actual history, making FIRECalc even more conservative than one would expect?

If that's the case, you've just added a layer of duct tape to my belt and suspenders...
 
+1

So this means for a portfolio which includes bonds, FIRECalc is showing a higher failure rate than actual history, making FIRECalc even more conservative than one would expect?

If that's the case, you've just added a layer of duct tape to my belt and suspenders...

But if it is not reflecting the change in bond prices, assuming a bear market in bonds is coming, wouldn't that make it less conservative in that case.
 
...Imagine the outcome back in Y2K with bond yields what they are now.
So, looking back, in 1980 to 2000 we have P/E expansion with the stock market. And then the interest has been generally in a decline since 1980 till recently, propelling VUSTX up an annualized nominal return of 8.7% from mid 1986 till its top in mid 2012.

Looking ahead, how can bond yield drop more so its value will appreciate? And how can stock P/E keep expanding? It looks like a 3.5% WR is prudent going forward. And I may have to give up my hope of seeing my stash keep on growing. Oh well!

By the way, Morningstar says VUSTX has a portfolio turnover of 105%/year. Holy cow! Its manager is trading like mad. But what is he exactly doing, I wonder?

First of all really good work.It is very important to realize that capital appreciation/loss of fixed income isn't included in the calculations. Not exactly a bug but returns that aren't easily replicated in the real world.
The likely capital loss of bond funds going forward are probably going to make up for the higher coupon rates.

My highest bond allocation was back in 2000/2001. I started selling bonds in 2009 and pretty much sold all bonds except for Sallie Mae inflation bonds this year. I wracked up some nice capital gains which were especially helpful in 2009 when equities tanked.

Regarding VUSTX, that is really weird fund. It only holds 29 bond issue mostly long term T-Bonds. Yet it has 105% turnover, but according to Morningstar it has very closely tracked its index. Obviously the folks at Vanguard know what they are doing regarding index, but I am sure puzzled.

As how to do better than 3.5% going forward, don't discount the higher growth rates of the US economy and most importantly the huge potential for developing country. Anyway this is my bull case.
 
...(snip)...
Looking ahead, how can bond yield drop more so its value will appreciate? And how can stock P/E keep expanding? It looks like a 3.5% WR is prudent going forward. And I may have to give up my hope of seeing my stash keep on growing. Oh well!
...
Maybe we have zero real returns in bonds for 3 or 4 years but then they could return to historical levels of 2.3% real returns for 5 year Treasuries. Over a 20 or 30 year period I could live with that scenario.
 
I know when I look at an analysis like this I think to myself what if it were me, I expect others do the same. I think the number of people who pull the trigger and retire 12 years before being eligible for a Social Security payout is smaller rather than larger.

I think it would be more realistic to include some amount for Social Security after 7 or 8 years of starting the retirement in this scenario and see the impact it would have on reducing the WR rate and strain on the portfolio.
 
So, looking back, in 1980 to 2000 we have P/E expansion with the stock market. And then the interest has been generally in a decline since 1980 till recently, propelling VUSTX up an annualized nominal return of 8.7% from mid 1986 till its top in mid 2012.

Looking ahead, how can bond yield drop more so its value will appreciate? And how can stock P/E keep expanding? It looks like a 3.5% WR is prudent going forward. And I may have to give up my hope of seeing my stash keep on growing. Oh well!

Plus, when you consider the yield on equities was roughly 4%-6% from 1900-1970ish, and current yields are barely over 2%, that also is a huge factor in comparing the worse-case 30 year run periods to today (i.e. if equities were yielding 4%-5% during most of the worst FireCALC 30 year runs, and you could withdraw 4%/year for 30 years, having equities yielding HALF of that today with marginal interest rates would definitely result in a worst case scenario if the equity capital growth doesn't perform significantly)
 
Having high dividend yields in the 1930's didn't save investors from severe declines. It's all about total real returns.
 
Plus, when you consider the yield on equities was roughly 4%-6% from 1900-1970ish, and current yields are barely over 2%, that also is a huge factor in comparing the worse-case 30 year run periods to today (i.e. if equities were yielding 4%-5% during most of the worst FireCALC 30 year runs, and you could withdraw 4%/year for 30 years, having equities yielding HALF of that today with marginal interest rates would definitely result in a worst case scenario if the equity capital growth doesn't perform significantly)

I am reminded of a recent thread when people discussed investing for total return vs. income. In the long run, without producing income how can an asset appreciate? Raw land price may go up if the surrounding gets developed, or a collectible item becomes pricey due to its rarity, but inert assets usually just keep up with inflation.

I prefer to have my bonds paying 2 or 3% above inflation, and my stocks paying 4 or 5% in dividends. As I can not get that, I have to take what the market gives me. To make up for bitty income, the market god gave me capital appreciation. And I realize that capital appreciation is an offer valid for some time only. Unlike dividends that you pocket, the capital appreciation may be retracted without notice. If you do not realize it, it may just vaporize overnight.

Yes, stocks go up and down. Same with bonds. The run-up in long bonds may be unprecedented, and with the interest rate having no room to go lower, I would not have any long bond right now. Earlier, when I said I believed in a balanced portfolio, I meant a diversified portfolio. The non-stock portion does not have to contain long bonds. It can be cash, CD, or short-duration bonds. The decline of long bonds started already in 2013, and I do not think it's over yet.

Still waiting for a stock correction, despite having 68% in equities. The latter looks the least negative of all assets, I think.
 
Last edited:
So, looking back, in 1980 to 2000 we have P/E expansion with the stock market. And then the interest has been generally in a decline since 1980 till recently, propelling VUSTX up an annualized nominal return of 8.7% from mid 1986 till its top in mid 2012...

Just for curiosity, I looked up cumulative inflation from mid-1986 till mid-2012. It's 109.57%. Annualized over 26 years, it's 2.9%/yr.

So, VUSTX had been giving a real return of 5.8%. Holy cow!

Now, coupled that with the stock rise during that time, is there any wonder how so many of us boomers could retire early, yours truly included? Talk about luck!
 
Last edited:
Back
Top Bottom