You are using an out of date browser. It may not display this or other websites correctly.
You should upgrade or use an alternative browser.
You should upgrade or use an alternative browser.
Gas & Electric Average Costs
- Thread starter Midpack
- Start date
Texas Proud
Give me a museum and I'll fill it. (Picasso) Give me a forum ...
- Joined
- May 16, 2005
- Messages
- 17,264
What number is for what year
No ledgend on the graph....
No ledgend on the graph....
OP
OP
Midpack
Give me a museum and I'll fill it. (Picasso) Give me a forum ...
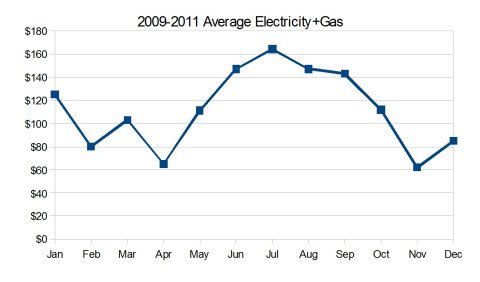
It's a high-low-average graph and average is probably the only useful number, OP modified to clarify, thanks...What number is for what year
No ledgend on the graph....
W2R
Moderator Emeritus
Interesting! Here are my monthly averages for 2009-2011, for a 1600 square foot house in New Orleans. The shape of the curve is very different, due to summer AC. Some LBYM attempts, but nothing extreme during these years. I also have a programmable thermostat, but leave it on the default settings to which it returns several times during the day (making it too hot in the summer and too cold in the winter). I then use the manual override to adjust when needed for comfort.
Attachments
Last edited:
Mulligan
Give me a museum and I'll fill it. (Picasso) Give me a forum ...
- Joined
- May 3, 2009
- Messages
- 9,343
Mine mirrors yours, W2R more than Chicago graph but a little cheaper. I have a programmable one but never bothered to figure it out. I used to lower it or raise it depending on the season before I went to work, but now the only time I touch it is when I switch to a/c from heat. I probably ave. around $100 a month over 12 months. I figure heating/cooling my house is the best $3-$4 a day spent out of my entire monthly budget!
ERD50
Give me a museum and I'll fill it. (Picasso) Give me a forum ...
For 2011, averaged $189/month for elec & NG. Largish house, two-four people in the house depending, and on a well.
-ERD50
-ERD50
JPatrick
Thinks s/he gets paid by the post
- Joined
- Jun 3, 2005
- Messages
- 2,610
For last 12 months the average was $166.
Thats for 2900 sq feet with a heat pump only--no gas.
SW Missouri
Thats for 2900 sq feet with a heat pump only--no gas.
SW Missouri
obgyn65
Thinks s/he gets paid by the post
"Free" for me (included in monthly assessment, as well as A/C, water, etc.).
scrabbler1
Give me a museum and I'll fill it. (Picasso) Give me a forum ...
- Joined
- Nov 20, 2009
- Messages
- 6,699
About $75 a month for me (studio apartment in a co-op apartment complex) which is mostly my own electric charges but includes a bit for the co-op's overall electric bill and total gas charges.
psweath
Recycles dryer sheets
My 2462 sq. ft. ranch-style about 15 miles north of Denver breaks down this way (monthly avg. over the last 12 months):
Gas - $59
Electric - $96
Total - $155
We aren't too frugal and can't stand to be hot, so that Electric bill is mostly the summer AC.
Gas - $59
Electric - $96
Total - $155
We aren't too frugal and can't stand to be hot, so that Electric bill is mostly the summer AC.
ratto
Recycles dryer sheets
- Joined
- Mar 11, 2011
- Messages
- 225
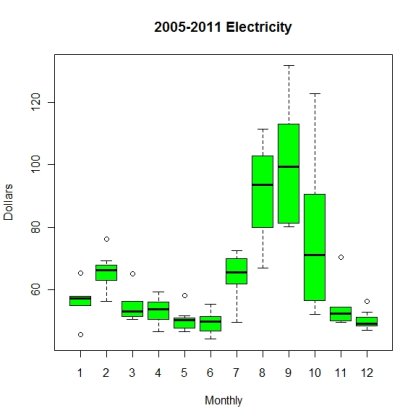
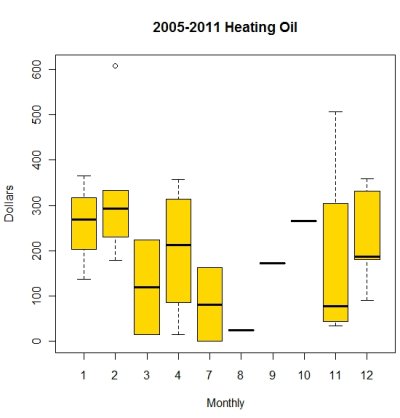
For our 2000 square foot home, here is the monthly electricity and heating oil breakdown. There is no heating oil delivery in May and June, so there is no historic data. The jump of electricity during summer is mainly due to the dehumidifier. In our area, heating oil price has doubled in the past 7-8 years, and its floating rate is now hovering around $3.7-3.8/gallon.
Attachments
Average monthly electric costs for our 1250' apartment. (No gas)
2009 $145 Last year working
2010 $95 On vacation 10 weeks over the summer months (June - Aug)
2011 $73 On vacation the whole summer.
When we are on vacation in the summer months I set the thermostat to 80 and turn off the water heater.
2009 $145 Last year working
2010 $95 On vacation 10 weeks over the summer months (June - Aug)
2011 $73 On vacation the whole summer.
When we are on vacation in the summer months I set the thermostat to 80 and turn off the water heater.
Katsmeow
Give me a museum and I'll fill it. (Picasso) Give me a forum ...
- Joined
- Jul 11, 2009
- Messages
- 5,308
At our old house that we sold 13 months our electric costs were about $500 a month in the summer and around $300 during non-summer. That house was 4500 SF, plus a guest house. It was also all-electric, no gas and was not very energy efficient at all.
We just moved from a 2000 SF rental that we were in for a year. Electric was about $250 a month during the summer and $60-80 the rest of the year. Gas was about $30 in winter and $18 the rest of the year.
We just moved from a 2000 SF rental that we were in for a year. Electric was about $250 a month during the summer and $60-80 the rest of the year. Gas was about $30 in winter and $18 the rest of the year.
W2R
Moderator Emeritus
Drilling down on my numbers a little more, I find that I have spent more on gas + electricity since I retired. I think this is because I am in the house a lot more now.
Average monthly gas+electricity:
2009 $93 Last year working
2010 $122 First year ER
2011 $122 Second year ER
Overall 2009-2011 average: $112
Average monthly gas+electricity:
2009 $93 Last year working
2010 $122 First year ER
2011 $122 Second year ER
Overall 2009-2011 average: $112
Last edited:
We average (over a full year) just over $200 a month.
Total electric 1,800 sf home in southern Ohio.
Much cheaper than our previous (nearby) home that used propane for heat.
Total electric 1,800 sf home in southern Ohio.
Much cheaper than our previous (nearby) home that used propane for heat.
"Thermostat"? "Heating zones"? "Heat pumps" and "swamp coolers"?
HECO charges about 31-35 cents/KWHr. The cost varies with the price of oil, which still provides 75-90% of Hawaii's power. Depending on how you crunch the numbers, the HPOWER trash-burning plant provides another 5-10% and solar/wind the rest. That's going to change dramatically over the next 20 years. Another HPOWER boiler comes on line next year, solar power is making steady grid penetration, and a wind farm is already building on the North Shore.
We have a 2400 sq ft home. When we renovated the familyroom last fall we made some energy improvements to the east windows and south roof, so tradewind cooling does more than enough so far. We haven't turned on the ceiling fans since the contractors left last November, and we still have most of the windows closed.
We moved into our "new" home two years ago and have been real happy with the energy cost. Our house was built in 1991 but I found out recently that seven years ago it was upgraded with insulation overhead. A new heat pump was installed at about the same time. House is 100% electric and our lowest bill was just last month at $79.30. Highest was $237.18 in August of 2011. I used to be concerned about our utility cost and always went for the levelized billing. With what we have spent monthly since we moved in I don't do levelized billing. When we need the A/C the thermostat is set at 78 degrees. In the "winter", if we need heat at all, we set it for 70 degrees. I suspect that the biggest usage of electricity is the four TV's going all the time.
REattempt
Recycles dryer sheets
- Joined
- Feb 27, 2010
- Messages
- 293
1500 Square Foot, 2 story Cape Cod, Upper Midwest, built in the 30s, plaster/lath, no insulation.
All values are average per month.
I set my budget at $255...I expected prices to go up, not down.
All values are average per month.
| Thru | Gas | Electric | Total |
| 4/12 | $63 | $98 | $161 |
| 4/11 | $94 | $117 | $211 |
| 4/10 | $116 | $104 | $220 |
Last edited:
DayDreaming
Full time employment: Posting here.
- Joined
- Jan 19, 2008
- Messages
- 848
I have an oil fired furnace & hot water heater, but my average monthly cost for electric + oil is:
2011: $177/month
2010: $213/month
It's an old house, about 1700 sq ft.
2011: $177/month
2010: $213/month
It's an old house, about 1700 sq ft.
freebird5825
Give me a museum and I'll fill it. (Picasso) Give me a forum ...
1700 sq ft raised ranch in lake effect country SE of Lake Ontario in upstate NY...
programmable thermostats in 3 upstairs heat zones, enclosed loop copper pipe/water system driven by natural gas furnace, roof heating wires, sparingly used gas dryer and oven...
12 month budget plan rings in at $261 each month for natural gas and electric combined.
"Delivery charges" are getting ridiculous, just about even with the actual energy usage costs.
target2019
Give me a museum and I'll fill it. (Picasso) Give me a forum ...
2010 Gas Heat, Hot Water, Clothes Dryer
$1912
2010 Electric, A/C, Ovens
$1713
2011 Gas Heat, Hot Water, Clothes Dryer
$1850
2011 Electric, A/C, Ovens
$1556
We have two complete HVAC systems. The house is over 3500 sq ft. These numbers surprise me, as we had additional insulation added to attic and crawl space at tail end of 2010. Heating and cooling costs should have been lower also due to moderate temps in NE. I'll blame it on wife and daughter.
aaronc879
Give me a museum and I'll fill it. (Picasso) Give me a forum ...
- Joined
- Jan 10, 2006
- Messages
- 5,351
I live alone in my 860 sqft condo and everything is electric:
2010:$106/mo
2011:$100
2012:$90(projected due to "mild" winter)
Highest bill for 1 month was $247.71 in Jan '11.
Lowest bill was $44.06 in July '10.
In the 4 years i've lived here i've never touched the A/C. I live half underground. If I look out the windows i'm looking at ground level so that helps keep it cool in the summer.
Last edited:
Grainiac
Recycles dryer sheets
- Joined
- Aug 12, 2010
- Messages
- 102
Interesting thread. Here are our monthly averages from the latest 12 monthly bills:
Natural Gas: $51 (house heat and two fireplaces in active use)
Electricity: $247 (house and outbuildings including wood/metalworking hobby shop with some very high power demanding tools)
Total $298
Our heated and cooled living space is about 5500 sq ft . The one outbuilding that we heat has wood stove so that cost is not included here. We live way up in the northern Midwest, so depending on the year heat is on for 7-8 months and AC for 2-4. The winter 2012 was really mild, so during a more normal year the total gas bill would be about 20% higher.
On the surface it would look like we are real energy hogs compared to most here, but relatively speaking it seems we still stay within reasonable cost per sq ft.
Natural Gas: $51 (house heat and two fireplaces in active use)
Electricity: $247 (house and outbuildings including wood/metalworking hobby shop with some very high power demanding tools)
Total $298
Our heated and cooled living space is about 5500 sq ft
. The one outbuilding that we heat has wood stove so that cost is not included here. We live way up in the northern Midwest, so depending on the year heat is on for 7-8 months and AC for 2-4. The winter 2012 was really mild, so during a more normal year the total gas bill would be about 20% higher.On the surface it would look like we are real energy hogs compared to most here, but relatively speaking it seems we still stay within reasonable cost per sq ft.
Similar threads
- Replies
- 26
- Views
- 2K
- Replies
- 2
- Views
- 627