2015 YTD investment performance thread

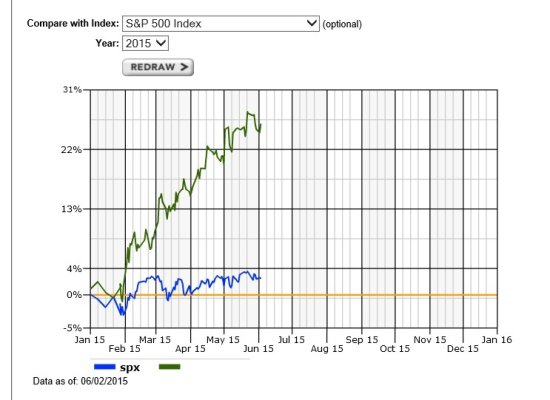
My trading account is up 28% so far this year. Don't get too excited, because it was up 70% last year in August and I finished dead even with the S&P500. I have even more time to waste my gains this year. At least I won't lose the gains the same way this year (oil drop got me last year)

Mines are up 19% and 11% (two trading accounts). Overall YTD is up 5%. Leaders are international funds. Laggards are Gold fund. Moved some bond fund into international ones.
 
As of end of May:
Taxable accounts up 2.1-3.1%
Tax deferred accounts up 4.1%
 
As an aside, I'm curious as to why you have VEMAX (Emerging Mkts Idx) in your portfolio. VTIAX already includes emerging in its index, are you looking to overweight it a bit? Also, some of your funds are Investor Shares and some are Admiral so the ER is a little higher.

Emerging markets are about 9.4% of the Total World ETF and no VEMAX would result in my being significantly underweighted in emerging markets. If I had no VEMAX I would only have about 5.7% in emerging markets (30% VTIAX * 19.1% emerging markets in VTIAX). Making the mix 27% VTIAX and 3% VEMAX increases my emerging markets to about 8.2% [(27% * 19.1%) +(3%*100%)], closer to the 9.4%. Perhaps I should consider increasing it a bit.

Good catch on VFICX... (that is the only non-Admiral fund that i could find). I changed it to VFIDX but any difference gets lost in rounding in the returns.
 
I seldom if ever check my accounts prior to the end of the year when I review and rebalance if necessary. This year I will be taking my initial RMD so I will probably be altering that process. I still like to review the quarterly paper summaries the VG sends to me. Other than that I don't peek.
 
End of May results:

Entire 60/40 Portfolio....+3.5%
Trading acct (5% of entire portfolio)....+12.4%
My Benchmark - Vanguard Wellington.....+2.3%
 
When I chart my trading account vs the S&P500 I can sort of see the correlation (if I squint). I certainly have more volatility than the S&P500 but higher gains too.
 

Attachments

  • chart.jpg
    chart.jpg
    86 KB · Views: 19
End of May 3.5%
 
When I chart my trading account vs the S&P500 I can sort of see the correlation (if I squint). I certainly have more volatility than the S&P500 but higher gains too.


I think you might be using the price index instead of TR.


Sent from my iPhone using Early Retirement Forum
 
I am up 3.05% without contributions for the year. It seems I've been about a 1/2 pt in front of the S&P all year.

I use google finance and I track performance on an individual and overall portfolio level. Tracked YTD, Past 6mos, SincePurchase and Overall Gains vs S&P. All of this is tracked realtime thanks to the awesome capabilities of Google Finance. I only need to add in the YTD Contributions to slice that piece of data out.
 
Calculating personal returns - Bogleheads

My IRA(50/50) account; Bogleheads personal returns spreadsheet
[FONT=&quot]Portfolio return as of[/FONT]​
[FONT=&quot]05/31/2015[/FONT]​
[FONT=&quot]1 month[/FONT]​
[FONT=&quot]0.19%[/FONT]​
[FONT=&quot]3 months[/FONT]​
[FONT=&quot]0.85%[/FONT]​
[FONT=&quot]YTD[/FONT]​
[FONT=&quot]3.18%[/FONT]​
 
Last edited:
I am up about 5% ytd, much of my portfolio is in Vanguard total market,VTI , which is only up 2% but my Apple and healthcare holdings ( FBIOX,VHT, PJP) are up significantly more. I have to admit the high healthcare pe ratios have me worried but I am going to hang on to them for now.
 
I am about same as 50% VTI and 50% VXUS.

Not doing all that good and downright proud of it...... Because all I need is what 50% VTI and 50% VXUs does an because I know I have discipline and plan..........
 
Took a few steps back this month. Back down to 3% gain. Still not bad. Had I retired, I could have lived with the 3% gain for the last 6 months.
 
Ugly. All annualized returns.

LTM: 3.26%
YTD: 4.89%
2Q15: 0.25%

3 years: 10.51%
5 years: 10.60%
 
YTD: 2.85%
1 yr: 5.24%
3 yr: 9.89%
5 yr. 8.96%
 
Last edited:
As of last night's close, I'm up 3.46% YTD. Not too spectacular, but I'll take it! I think I had topped out at around 5.9-6% at some of the peaks.

And, that 3.46% still represents about 90% of what I've grossed so far at the j*b this year.
 
On 6/30 my retirement portfolio was up 1.9% after withdrawals.

Just 2 trading days prior, it was up 2.9%.

It's hard for me to get excited about specific date performance as things fluctuate so much throughout the year.
 
I was up 4.1% net of fees as of June 30th, but only up 3.2% as of July 31 with a change in manager for a lower fee.

See my other posts on FIRE and Money regarding managers,:facepalm:
 
Back
Top Bottom