2016 YTD investment performance thread

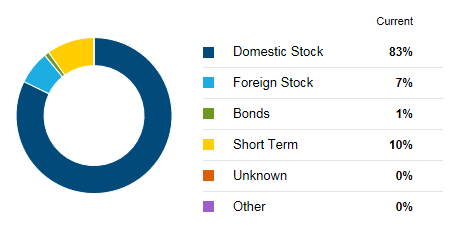
Based on 2016 full year time weighted average, inclusive of dividends, margin interest and all brokerage fees and excluding the impact of any additions or withdrawals from principal, I was up 10.4% versus 11.9% for the benchmark SP 500.

So I failed to 'beat the market' this year.

Big reason was a very weak start to the 2016 where at one point I was down 18%. I spent the rest of the year trying to catch up but didn't quite make it.

Biggest loser was trying to play mini arbitrage on the failed HAL - BHI merger.

Biggest winners were the energy names - APC, PXD and CXO - which rallied strongly in the second half.

2017 is another year - starting out well, lets see how it goes.


4cbzhiV3slbd79t-ZKjMjrLKUYH_z31xeIk74BeCdcq7qr0KIYMMfTBiXPEaiqq5FUcQ-RuAyxhoWe1Pc-jR7uN72H7Ya0lbCNkILhq7PHmMsFfjILcTLzNUtTfrjqs0iM8l5jtBPbgVjkIho1LiV3_wcTgooFBtA7pYFRLto9mhRsUS2nay93xlDfflUrOZT0Dt4L4bIkqqiolydjLr5CDWt07adfIkzanjp58rN-Z--KoVXf3b0CT8zjFXQwDRVRUhQrxIKxzEuYBCcELtukNGBldBUb3Pbgl7PeqslHuAQv2nFgxBqbeC1r3KO5GEw4aEe1YNe9WwQhLOvf5s27q1-oim1Qt7sgWId3WHH1gzo24g6q45mQ1LR1kQPvHkETslM9L6WZu23Pjs22ExTFjk0ZCzNUxIL7CuR52GQ1XBYpfiIB2CXQKMf9Occpzm1ygTHToH-sWP0opIHMxQvwCTLUuDGOejDdcPYqXNLy3x6ncSJ__YkMSWhQfvySZlL_quaruwRIKCFfUL5hJpReI8PrSIBiyfYauDMI-Tfil3ufuW0MnTtmMQ9VaWjM4eFRxJLwB2jhi0NuDet63ReiSOHcgP_qq6BA7_hna2594Ozljq56J6=w1366-h539-no


Early in 2016, you lost about 2.5x the drop of the S&P. That was surely stressful.

.
 
Not to worry. There's always that One Little Indian who won't post the YTD results for their own portfolio!
I am worried abotu the one who withdraw their SWR every year and put it aside if they do not spend it. After a few years they have quite a stash that is not part of their "portfolio" so I think this threads are not be be believed. I have 20% in cash which pulls down my performance this year. If I exclude that, my returns go up.

So what are we proving?

Good point.

As I quoted earlier, my total return was 8.9%.

So, all the numbers are in.

My return for 2016 is ... drum roll please... 8.9%.

At 59% stock, 36% cash, and a bitty bit of bond, I trailed Wellington which is at 11.2%.

If I held 60% of VTI (total stock) which returns 11.6% and 40% of BND (total bond) at 2.5% and never rebalanced during the year, I would have 8%. So, I am not doing too badly.

PS. Note how Wellington, even though it is only 60% in stock, matches the total stock index. Good stock picking or luck? It is the perennial question. :)

If I excluded my big pile of cash which earned 2%, my return would have been 12.8%. Now, most of my equities at this point are in individual stocks. If I further excluded the MFs, I could boast of even higher returns. :)

But I know the real growth of my money is not that high, and there is no point in telling myself I have all this growth that I do not have, or fooling myself that I am that smart. For if I were smart and were certain to make that much money, why would I keep any uninvested cash? If I were so sure I was smarter than the MF managers, why did I keep any money with them?
 
Last edited:
I don't know if I can completely trust the reporting from Fidelity but according to them we averaged 14.6% across the variety of accounts we have with them. The allocation is 91% stock / 1% bonds / 8% cash.

Every stock/ETF, except one (BRK_B) pays a dividend.


on edit: I see Fidelity is only reporting through the end of November. I guess it will be a few days into 2017 before the true 2016 total is available. The allocation will change a bit too. I think we ended up with closer to 10% cash. I will report back when updated information is available.

Here's the latest from Fidelity for January - December 2016:

17.13%

We have very little bonds although we do have a number of utilities which act like bonds in some ways. For 2016 we had more cash (~10%) than normal - we usually have less than 5% cash since we essentially live on the dividends. Fidelity has the final allocation as follows.
 

Attachments

  • analysis.PNG
    analysis.PNG
    14.2 KB · Views: 27
Last edited:
Had my annual review (over the phone) with my FA yesterday and all looks good. We came out of 2016 with 12.8% including his fees. Not bad.

My muni bonds and muni bond funds (not with him) were completely flat. The price decline matched the interest generated. Of course my cash was flat too, under 1%.

So the weighted total over all was 9.7% which makes me quite pleased.
 
I'm a bit late closing the books on 2016.

Portfolio grew 10.6%. I get same answer using XIRR, moneychimp calculator, and using M* total return for each ETF weighted on current value. This latter method enables more effective analysis vs anything done at the total portfolio level.

Benchmark is a 60/40 mix of VTI/BND, which was up 8.7%. Our equity side was up 13.1%, just slightly higher than VTI at 12.8%. We have some high-dividend ETFs which did quite well (VYM and others, up 17.0% collectively). But this was largely offset by our international ETFs, which were up only 6.2% collectively. The bond side was up 5.8% vs BND at 2.5%. This results from 2 corporate bond ETFs: LQD (investment grade, up 6.2%) and HYG (high yield, up 13.4%).

The overall 10.6% figure excludes cash and rental real estate. Cash allocation is 3%, earning 1% at Ally. Rentals are 16% of the portfolio. They generated 6% after-tax cashflow and, according to Zillow, increased 22%. We're up 13.0% if I include all that.

Nice year overall. I'm quite happy with it.
 
Had my annual review (over the phone) with my FA yesterday and all looks good. We came out of 2016 with 12.8% including his fees. Not bad.

My muni bonds and muni bond funds (not with him) were completely flat. The price decline matched the interest generated. Of course my cash was flat too, under 1%.

So the weighted total over all was 9.7% which makes me quite pleased.


Cool. Thanks for your encouragement this year to all of us to spend more dough.

Just curious, does your 12.8% you were quoted from the advisor jive with a quick and dirty calc like (ending balance - starting balance + withdrawals)/starting balance.
 
Yup, just checked again, no "hokus-pokus" in the numbers. I didn't withdraw anything, but his fees are included.

Yeah, blow some dough, have some fun! I'm retired for 2 and a half years now and I got more dough than when I started.

Gotta blow more dough - :)
 
My return for 2016 is ... drum roll please... 8.9%.

At 59% stock, 36% cash, and a bitty bit of bond, I trailed Wellington which is at 11.2%.

If I held 60% of VTI (total stock) which returns 11.6% and 40% of BND (total bond) at 2.5% and never rebalanced during the year, I would have 8%...

...Benchmark is a 60/40 mix of VTI/BND, which was up 8.7%...

The above caught my attention, so I double-checked my numbers. Apparently, I looked up the performance of these ETFs too early on Dec 30th, and not all dividends were included in the numbers. My portfolio had some late dividends too, but these were not significant.

So, I looked it up again. According to Morningstar, VTI return was 12.68%, and BND return was 2.57%. The 60/40 blend with no mid-year rebalancing would have a return of 8.64%. My earlier number was too low, and missed by 0.64%. That minuscule 0.64% is important nowadays when CDs are paying a meager 1%.

My active investing barely matched that benchmark. It's nothing to brag about, although I held a lot of cash instead of bonds.
 
Last edited:
late...

Little late to the party, only now sat down and figured this out. 9.0% for 2016. 46 stock/27 cash/23 bond/4 REIT

Interesting thread, in that at least for last year it doesn't seem there were particularly large swings in returns from one portfolio to the next relative to riskiness of allocations. I was expecting to see a bit more
 
I think that's because certain equity asset classes did far better than others in 2016. If you had a large position in international it hurt. If you had a big chunk in large cap US value, it helped a lot, as did US small cap exposure. So the underlying equity AA made a big difference.

Here is the latest Callan Periodic Table of annual asset class performance which includes 2016.
Callan_Periodic_Table_of_Investment_Returns.png
 
Last edited:
Here is an article about how there is a tendency to compare your personal rate of return against the S&P 500, but that's "one half of one asset class". The suggestion is to compare with a world index, diluted by your bond allocation. If you look-up your bond allocation the figure you find is what you "should" be comparing your return to.

With the S&P coming in at 11.96% and the MSCI All Country World Index 8.48%, it makes it a bit easier (this year anyway), to compare to the world index.

2016: For me 6.8%, so about 0.8% above this benchmark.

2016-benchmark-returns.jpg
 
Last edited:
Back
Top Bottom