2020 Investment Performance Thread

I completely agree. It was just the comment I keep seeing "after subtracting expenses" that got me wondering. I certainly didn't think homes, cars, precious metals, art, ect would be included. And I guess I would have to agree that NW would include these.
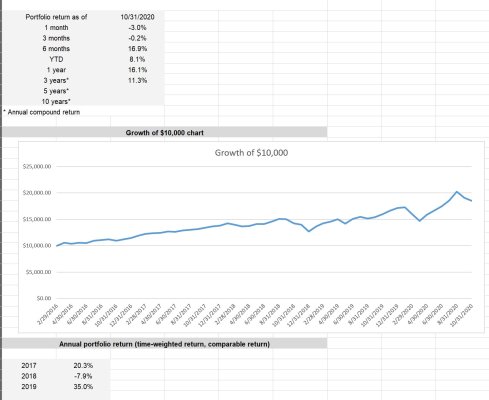
Yeah, it's for fun and starting conversations. I have a sheet going back to 1990 where I recorded monthly account totals and in some cases individual funds. When I look at the area graph for 30 years, that is sufficient for me. But I can see why monhly performance details are important too.

People have different methods for calculating performance, and I that keeps this game interesting. There have been posts from time to time where methods are laid out.
 
I use the "Bogleheads_Returns.xls" and enter new data at the end of each month.
 

Attachments

  • Bogleheads_return.jpg
    Bogleheads_return.jpg
    181.1 KB · Views: 39
I completely agree. It was just the comment I keep seeing "after subtracting expenses" that got me wondering. I certainly didn't think homes, cars, precious metals, art, ect would be included. And I guess I would have to agree that NW would include these.
Adjusting for expenses is required if you sum all liquid accounts (spending accounts and portfolio accounts). If you just included your investment accounts, then when you moved money in and out, it would distort the numbers. One could adjust for those movements, as one alternative, or do the "all-in, spend adjusted", which is a pretty good estimate if your spending isn't too lumpy throughout the year and spending lumpiness is small when compared to market movements.
 
Adjusting for expenses is required if you sum all liquid accounts (spending accounts and portfolio accounts). If you just included your investment accounts, then when you moved money in and out, it would distort the numbers. One could adjust for those movements, as one alternative, or do the "all-in, spend adjusted", which is a pretty good estimate if your spending isn't too lumpy throughout the year and spending lumpiness is small when compared to market movements.

Thanks. That makes sense. I guess I was looking at it too simply.
 
Don't know what to think about this market. But I'm staying the course come what may. XIRR of 12.9% as of 11/5 with 60/40 3 fund portfolio with 2 rebalance events this year.
 
7.4% YTD as of 10/31, on an roughly 60/40 portfolio.
 
Up a little over 5% YTD as of today.

AA stock/bond/cash approx. 36/10/54 - afraid of bonds
 
I normally don't check mid-month, but with the current run-up:

+10.5% YTD
AA: 55/45

Invested assets, after all spending, are now 41% more than retirement date almost 5 years ago.
 
Up 12.6% today with a 50/50 asset allocation. Looked a little better yesterday. :)
 
Jan +1.12%
Feb -6.18% due to COVID-19 fear
Mar -18.25% COVID-19 triggers 3 circuit breakers and 2TT+ in stimulus. This time IS different.
Apr -6.10% Back to Feb levels. Wasn't as fortunate as Lord Ackman and his 2.6BB short. The world has changed.
May +.82% my city burns around me by way of rioters, but hey the folio turned pos again
June +4.3% For some reason I feel like this is where it 'should' be? I anticipate slower growth in the next 2 quarters. Remember the Tariffs?
July +13% Thanks to the AAPL 4:1 split, folio back at records.
August +22.2% I sorta expected to be here somehow but under different circumstance. AAPL has been the winner
September +18.9%
October +15.43% with elections 2 days away
November+29.45% Gobble gobble! 100% equities :dance:
 
^^^Wild ride, kgtest!

You have no idea! I didn't do anything but stay the course and keep buying on our DCA contributions every week with our paychecks as we keep accumulating!

It's basically another sign of the times honestly and a good reflection of the events of the year as well! I had so many people calling/texting at one point when I think I personally was down almost 30% intra month asking me for advice. I was always told if you had a solid investment plan you could sleep well, and I did...for the most part :rolleyes:
 
13.74% per Money Chimp calculation with a 50/50 portfolio. It's been a strange year, but profitable so far!!
 
13.74% per Money Chimp calculation with a 50/50 portfolio. It's been a strange year, but profitable so far!!


Wow, we are very close! It's 13.76% for me, also per Money Chimp method. However, I have more stock at 55.75% right now.

It compares very well against the S&P, particularly as I do not have any of the high P/E stocks, or the high flyers with negative E. Even my semiconductor holdings have a lower P/E ratio than the S&P.

Additionally, I have some oil stocks whose poor performance detract quite a bit off the total portfolio return.

Overall, I am happy with what I get.
 
Last edited:
Up 10.94% YTD as of yesterday...haven't gotten today's returns yet.

I tried to time the exit/entrance back in March/May and didn't so well, from now on, I will let it ride. I lost about 15% gains this year with that strategy (or lack thereof).
 
2020 has been a wild ride. Down 27.4% in March to up 17.8% as of this weekend.
 
Here's my latest, after this morning's update. These are YTD numbers, not month-over-month...

+0.23% on 1/31/2020.
-6.78% on 2/28/2020.
-21.45% on 3/31/2020.
-13.31% on 4/30/2020.
-8.82% on 5/29/2020.
-6.56% on 6/30/2020.
-2.32% as of 7/31/2020.
+2.99% as of 8/31/2020.
-0.89% as of 9/30/2020.
-1.90% as of 10/30/2020.
+7.91% as of 11/30/2020.

As for highs and lows earlier in the year, I peaked at 4.67% on February 19, before the COVID smackdown, and bottomed out at -30.47% on March 23.

Also, while September and October ended up closing out as down months, they were still a bit of a wild ride. I briefly hit a new peak of 4.70% YTD on September 2, and 3.92% YTD on October 12, even though both of those months finished negative.

I had hit a new peak of +8.37% on 11/27, so yesterday was a bit of a letdown from that. But still, a very nice finish to the month!
 
Back
Top Bottom